All Posts
The new, third edition of Frederick Pratter’s Web Development with SAS by Example recently came out to great fanfare. Updated for SAS 9.2 and SAS Enterprise BI Server 4.3, Web Development with SAS by Example, Third Edition, introduces readers to Web programming using real-world examples and SAS Web programming tools. So


This is your chance to be a part of what has made SAS Global Forum a focal point of innovation in the SAS community for more than three decades. Now through November 14, paper submissions are being considered in the technology and industry solutions tracks. It’s time to write up

This week’s featured SAS author’s tip comes from SAS user extraordinaire Ron Cody. Honestly, because Ron has written so many SAS books, I could probably feature a year’s worth of tips from his work alone. To find something useful in any of Ron’s books, one merely needs to let the
I bet that many of you reading our blog are familiar with accomplished SAS users and authors Lauren Haworth, Cynthia Zender, and Michele Burlew. Together, they form a powerful triumvirate of SAS experience. If you get a chance to pick up their book Output Delivery System: The Basics and Beyond
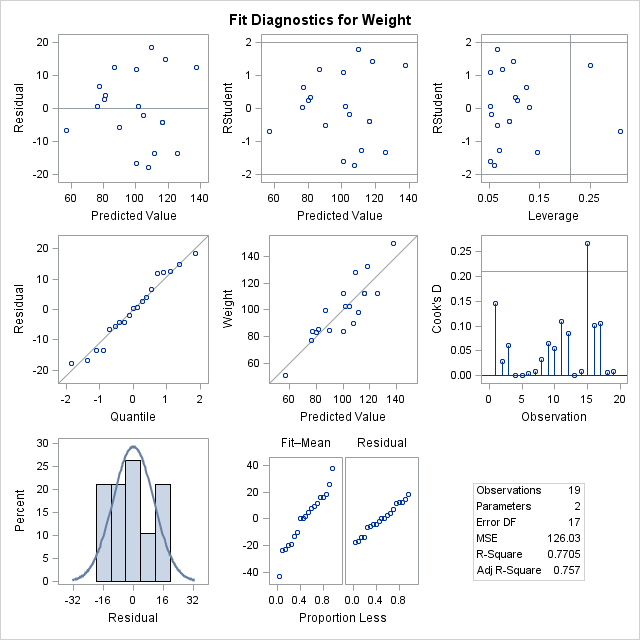

One of the great innovations with SAS 9.3 is the focus on ODS statistical graphics. "Wait a minute," you're thinking, "weren't ODS graphics added in SAS 9.2?" Yes, that's true. But with SAS 9.3 there is even more capability: more analytical SAS procedures support the graphs, and there are more


Most of us grew up playing some type of sport and dreaming of becoming a collegiate or professional athlete. For me, it was a focus on dance and striving to be a professional ballerina. At some point we realized that in order to make this dream a reality, we’d have

It seems like such a simple problem: how can you reliably compute the age of someone or something? Susan lamented the subtle issues using the YRDIF function exactly 1.0356164384 years ago. Sure, you could write your own function for calculating such things, as I suggested 0.1753424658 years ago. Or you

SAS Enterprise Guide sets values for several useful SAS macro variables when it connects to a SAS session, including one macro variable, &_CLIENTPROJECTPATH, that contains the name and path of the current SAS Enterprise Guide project file. (To learn about this and other macro variables that SAS Enterprise Guide assigns,
As I write this, SAS 9.3 has not yet been "shipped", but its release is imminent. I've already heard many questions about how SAS Enterprise Guide works with the new version, so I decided to write this "Frequently-soon-to-be-asked questions" document to help sort it out. What version of SAS Enterprise

The recent issue of InformationWeek features a Q&A session with Ken Thompson, one of the creators of the Unix operating system. (He collaborated with Dennis Ritchie, of C language fame. Since much of SAS is written in C, I daresay there are a few copies of K&R around here.) One
Here at SAS Press, we offer a strong, stable publishing team with over 55 years of combined experience. But as a potential author (or even current one) or fan of our press, you might want to get a better feel for the people behind the book. Thus a new feature,

Last week, I attended the International Center for Leadership in Education’s Model Schools Conference in Nashville, TN, where I learned about many forward-thinking education initiatives taking place across the country. My colleagues and I also had the privilege of facilitating a SAS(r) EVAAS for K-12 presentation from two principals at
About a year ago (wow, has it been that long?), I posted an example program that lets you report on the contents of a SAS information map. Using my example, you can see the data items, filters, and folder structure within a given information map. Last week a reader posted


As far as numbers go, the number zero is rather mysterious for data. Is it something or is it nothing? What happens when you have missing data but enter 0? This topic triggered an intriguing discussion in my recent Programming 2: Data Manipulation Techniques class. In this post I’d like
We sometimes take it for granted, but the concept of the "SAS library" is just about one of the most awesome aspects of The SAS System. You can give your library a name (a library reference, or libref), tell the system how to get to your data (options on a