All Posts
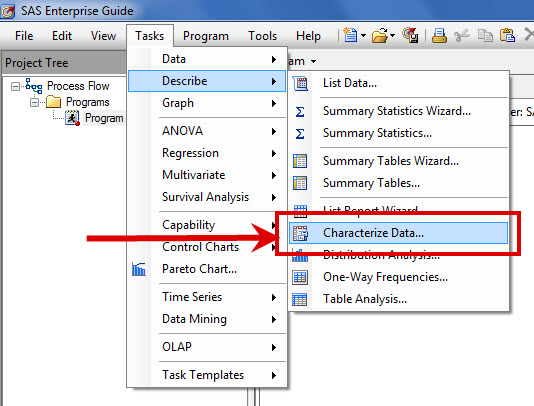

During IFSUG yesterday, Sunil Gupta gave attendees to his presentation a special homework assignment. Look into the SAS Enterprise Guide task 'Characterize Data'. Sunil suggested that this was a simple approach to quickly getting a summary of all the variables within your data table. Of course, some programmers will use


"Bad data does exist," says Sunil Gupta, SAS author and Global Corporate Trainer, Gupta Programming. Gupta is an expert in the pharmaceutical and medical device industry, but he volunteered this week to speak to an audience of SAS users in the insurance and financial services industries about minimizing the impact and

Today at IFSUG, Chuck Patridge presented a wonderful talk about how to complete fuzzy matching using BASE SAS tools. Chuck has been programming SAS since 1979 and has been tasked multiple times with coming up with in-house solutions to address business needs without the software costs that are typically associated

Bubble plots are often used to display social and economic data as Gapminder effectively does. With the addition of the BUBBLEPLOT statement to SAS 9.3, it is now possible to create bubble plots in SAS with a few lines of code: proc template; define statgraph bplot; begingraph; entrytitle 'Bubble Plot


By show of hands, I’d like to know what you consider to be the most exciting day of SAS Global Forum

As a SAS developer, I am always looking ahead to the next release of SAS. However, many SAS customer sites migrate to new releases slowly and are just now adopting versions of SAS that were released in 2010 or 2011. Consequently, I want to write a few articles that discuss
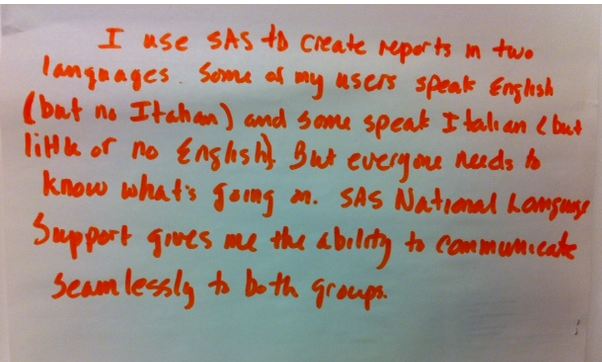
If you've never lived outside of your own small town, you might not realize that each country has a distinct way of writing and formatting currency and numbers. This can be a real problem when working with data and code - I'll bet some of you are already aware of
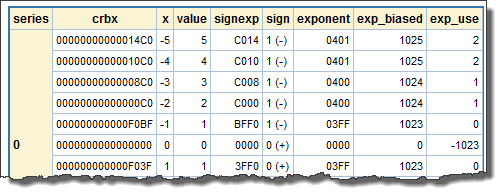

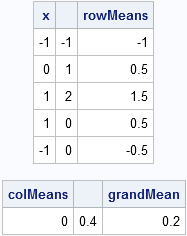
About once a month, a customer approaches SAS and asks a question of significance. By "significance", I don't necessarily mean "of great importance", but instead I mean "of how SAS handles large numbers, or floating-point values with many significant digits". In response, we always first ask why they asked. This

In the previous post, “Roses are red, violets are blue…”, I discussed the general problem of getting style attributes to line up with specific group values and some ways to overcome the problem. In this installment, I want to elaborate on the attribute map functionality in the Graph Template Language


Neil Constable is a Principal Education Consultant at SAS in the United Kingdom, where he applies his extensive knowledge of Base SAS, SAS Enterprise Guide, and the SAS business intelligence tools. He's also the author of SAS Programming for Enterprise Guide Users, Second Edition--and this week's featured tip. You can get to know Neil


This question came up while helping my presales colleague with a client’s question: “Is Microsoft Excel in direct competition with SAS?” Not really. I like to think of SAS as partnering with Excel. Because of the following Excel benefits and its synergy with SAS. Excel has been around for years.


Usually when you hear the expression "That's gonna leave a mark!", it's a bad thing! ... But, in this case, it's actually good! Since many of you SAS Global Forum attendees and/or your family members might be visiting the Disney park, I thought it would be fun to use SAS/GRAPH®
This classic start to a romantic poem assumes that the correct colors are always assigned to the correct flowers; but, for those who create graphs for reports, consistent color assignment can be more of a challenge than an assumption. This challenge is particularly true for the display of group values.
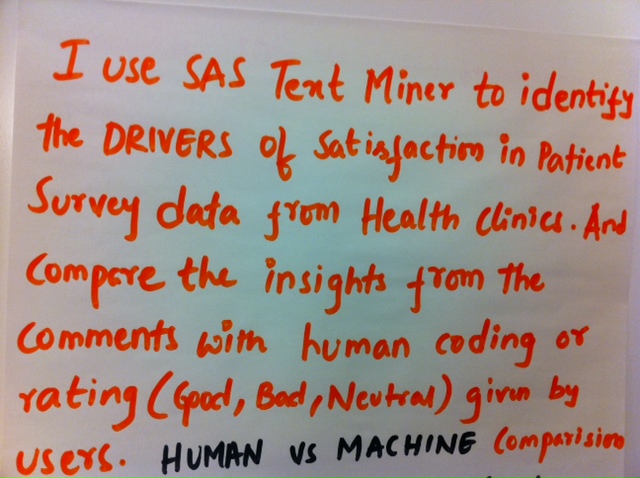
How are you determining customer satisfaction? How do you move the needle? This SAS user mines the unstructured data in patient surveys with SAS Text Miner.

Here is the promised follow up on the Dashboard graph. In the previous article, I posted the code to create a panel of bullet KPIs displaying three different metrics. For each KPI, I used 5 columns of data which resulted in a wide and inconvenient structure. A more convenient data structure is