A recent question by a user lead led me to experiment with what is often referred to as conditional highlighting. The user wanted to display a bar chart of response by year, where each bar is colored by year, and show a cross hatch pattern on the bars where the sample size is < 30.
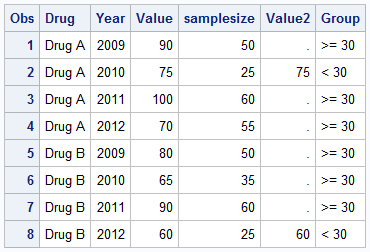
We can show the conditional highlighting using the fill patterns included in SAS 9.3. Here is the data where we have computed two additional columns (Group and Value2) based on sample size.
Data:
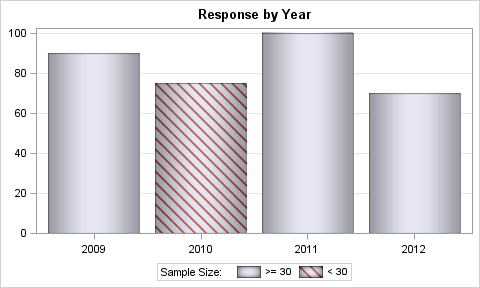
Now, In the simple case, not using Drug as group, the principles of effective graphics would suggest it is not necessary to use color for each bar by year. So we can use groups to indicate where the sample size is < 30.
Most styles do not have fill patterns included in the graph data elements. Only Journal2 and Journal3 have these enabled by default. However, you can certainly derive your own style and enable fill patterns as shown below.
SAS 9.3 SGPLOT graph:
SAS 9.3 SGPLOT Code with custom style:
/*--Create custom style adding fill patterns to GraphData1 and GraphData2--*/ proc template; define style conditional; parent=styles.htmlblue; style Graph from Graph / attrpriority = "None"; style GraphBar from GraphComponent / displayopts = "fill outline fillpattern"; style GraphData1 from GraphData1 / fillpattern="E"; style GraphData2 from GraphData2 / fillpattern="L2"; end; run; /*--Grouped Bar Chart using SGPLOT Chart--*/ ods listing gpath=&gpath style=conditional; ods graphics / reset width=5in height=3in imagename='GroupBySampleSize'; title 'Response by Year'; proc sgplot data=conditional(where=(drug='Drug A')); vbarparm category=year response=value / group=group fillattrs=(color=cxdfdff0) dataskin=pressed; xaxis display=(nolabel); yaxis display=(nolabel) grid; run; |
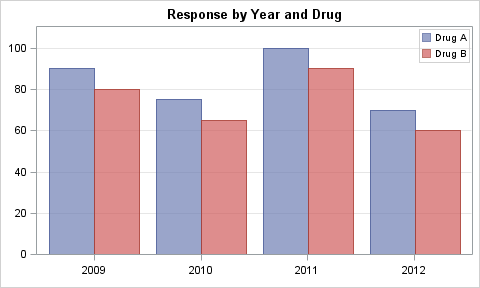
But what if we have a cluster grouped bar chart with "Drug" as the group variable? How do we add the conditional highlighting? Let us start with the basic cluster grouped bar chart of Response by Year and Drug. See graph below.
SAS 9.3 GTL Clustered Bar Chart:
SAS 9.3 GTL code:
proc template; define statgraph BarChart; begingraph; entrytitle 'Response by Year and Drug'; layout overlay / xaxisopts=(display=(ticks tickvalues)) yaxisopts=(display=(ticks tickvalues) griddisplay=on offsetmax=0.1); barchart x=year y=value / group=drug name='a' groupdisplay=cluster datatransparency=0.2; discretelegend 'a' / location=inside valign=top halign=right across=1; endlayout; endgraph; end; run; ods listing gpath=&gpath style=htmlblue; ods graphics / reset width=5in height=3in imagename='BarChart'; proc sgrender data=conditional template=BarChart; run; |
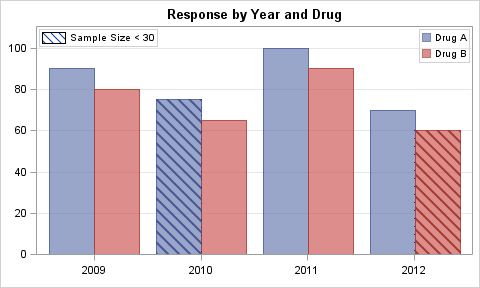
Now, we want to add a layer on top of this using the cross hatched fill pattern based on sample size. To do this, we compute another column "Value2" which has the same values as "Value" when the sample size is < 30. For sample size >= 30, the "Value2" is missing. We will overlay a bar chart on top of the previous, using Value2 as the response. Bars will only be drawn where the data is not missing.
We turn on the display of fill patterns and turn off the fill colors as follows.
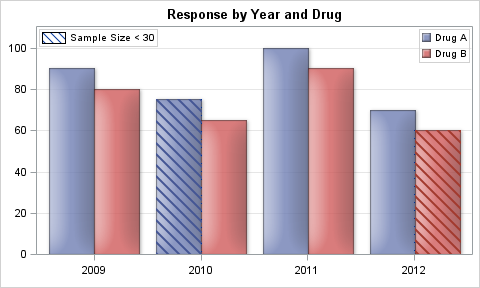
SAS 9.3 GTL Clustered Bar Chart with Conditional Highlighting:
SAS 9.3 GTL Code:
proc template; define statgraph ConditionalHighlighting; begingraph; entrytitle 'Response by Year and Drug'; layout overlay / xaxisopts=(display=(ticks tickvalues)) yaxisopts=(display=(ticks tickvalues) griddisplay=on offsetmax=0.1); barchart x=year y=value / group=drug name='a' groupdisplay=cluster datatransparency=0.2; barchart x=year y=value2 / group=drug display=(fillpattern) groupdisplay=cluster fillpatternattrs=(pattern=L2); barchart x=year y=value2 / display=(fillpattern) groupdisplay=cluster barwidth=0 fillpatternattrs=(pattern=l1) name='b' legendlabel='Sample Size < 30'; discretelegend 'a' / location=inside valign=top halign=right across=1; discretelegend 'b' / location=inside valign=top halign=left; endlayout; endgraph; end; run; ods listing gpath=&gpath style=htmlblue; ods graphics / reset width=5in height=3in imagename='ConditionalHighlighting'; proc sgrender data=conditional template=ConditionalHighlighting; run; |
Note, in the above code, the third BarChart statement is used only to allow us to generate a separate legend entry. The bar width of this bar chart is set to zero. We can add a data skin to enhance the visual appearance.
SAS 9.3 GTL Clustered Bar Chart with Conditional Highlighting and skins:
Full 9.3 SAS code: ConditionalHighlighting


