All Posts


We're at stop #3 on the crash analytics highway. We've introduced the topic of the Four E's and have discussed the role of analytics in Enforcement. Now let's talk about Engineering. Safety, reliability and accessibility are all key components in road design. Traffic engineers work to make the driving environment


In the SAS/IML language, a user-defined function or subroutine is called a module. Modules are used to extend the capability of the SAS/IML language. Usually you need to explicitly load modules before you use them, but there are two cases where PROC IML loads a module automatically. Modules in IMLMLIB

Recently, I came across an interesting graph showing Euro contries bank exposuro to GIIPS countries, as percent of GNP. Here is the graph: I thought I would see how far I can get in making a similar graph using SAS. I made up some data with response values for a Product x


I found this great video on AllAnalytics.com. It was shot while you guys were at SAS Global Forum and has soooo many great SAS users talking about the reasons that you love to go to SAS Global Forum. Take a look: Now that you have heard their reasons, tell me
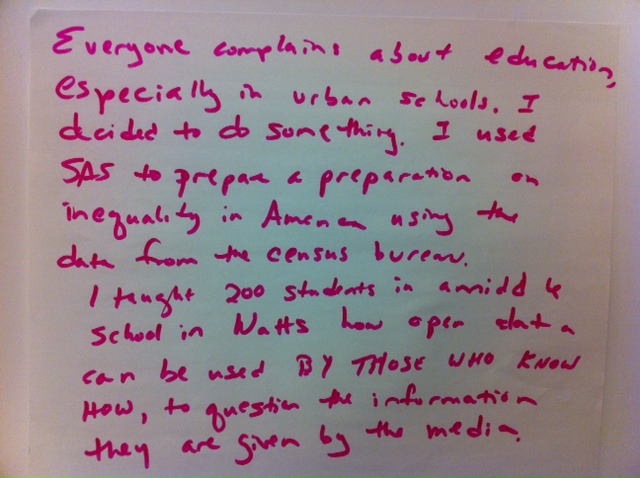
Put up or shut up is one of those great sayings from my generation. Loosely translated it means, stop complaining if you aren't going to do something about the problem. In this week's Innovation Inspiration, the author decided to teach American middle schoolers how to question the information that they
This post is a result of an intriguing question posed by a user on the SAS communities' page. How to create a bar chart where the category is a combination of two variables var_1 and var_2 (each with values of '+' and '-'), and get a X axis that shows each

If you missed PharmaSUG - as I did - you still like to stay on top of the great information that comes out of the conference. I found the list of Best Contributed Papers and decided to post them here for you. There is a lot of other great information

If you're looking for some good stuff to read ... I mean great stuff for SAS users, I've had this list brewing in my head for a few weeks now. (The reason that I ask is because in the US, this weekend will be a three-day holiday to commemorate Memorial Day. So, many families will
In a previous blog, I showed how to use SAS/IML subscript reduction operators to compute the location of the maximum values for each row of a matrix. The subscript reduction operators are useful for computing simple statistics for each row (or column) of a numerical matrix. If x is a


On the SAS-L mailing list, a participant posed this question (paraphrased): How can I tell which date format my Windows session is using: European format (with day first) versus USA format (with month first)? I'm reading in output from a Windows file listing, and need to know how to interpret


In August 2011, we expanded the scope of the SAS Global Forum blog and rebranded it as the SAS Users Group blog. Our goal was to create one vibrant and dynamic spot for content related to SAS users groups and SAS user presentations. The result has been terrific! Many new
At SAS Global Forum, and again at PharmaSUG, we had the pleasure of attending many papers and presentations on various topics that included graphs in the power point decks or in the papers. More often than not, the graphs exist along other text, and occupy a smaller part of the screen

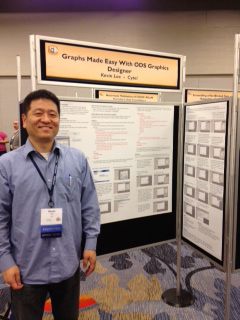
At SAS Global Forum, one of the most difficult areas for me to show to you are the poster presentations. This year, I asked Steve Polilli, a colleague who is great with a Flipcam, to video a few for me. I picked out three that I will use in the
Here is the last video from the last day at SAS Global Forum 2012. This one is great! Make sure you stay in there long enough to watch the outtakes: they are so funny!
PharmaSUG 2012 conference drew to a close today, concluding two and a half days packed with papers, presentations, posters, hands-on demos and super demos by SAS staff. While the weather outside was a bit chilly from time to time, the conference what hopping with many user papers on how to