Recently, an interesting question was posed on the previous article on this blog by a reader. Can we use the new DiscreteAttrMap feature to create just a legend with specific entries, with no graph. The question was intriguing enough that I did not wait to ask - "Why?". I just got busy coding just to see if it can be done.
Turns out, yes you can do this using GTL. In the example below, I have defined a DiscreteAttrMap with three values, each having a Line and a Marker representation. The DiscreteLegend uses the DiscreteAttrmap only. However, there must be at least one plot statement for output to be created. So, we have added a simple scatter plot and made the markers of zero size. Also, we have to prevent the drawing of the axes and the wall.
Here is the template for this case.
V9.3 GTL Code:
proc template; define statgraph DiscreteAttrMapOnly; dynamic _type; begingraph; discreteattrmap name="Product"; value "Chairs" / markerattrs=(symbol=circlefilled color=blue) lineattrs=(color=blue thickness=2); value "Tables" / markerattrs=(symbol=trianglefilled color=green) lineattrs=(color=green thickness=2); value "Lamps" / markerattrs=(symbol=squarefilled color=red) lineattrs=(color=red thickness=2); enddiscreteattrmap; layout overlay / walldisplay=none yaxisopts=(display=none) xaxisopts=(display=none); scatterplot x=height y=weight / markerattrs=(size=0); discretelegend "Product" / type=_type across=3 location=inside halign=center valign=center displayclipped=true; endlayout; endgraph; end; run; |
Running this template with _type='Marker' creates the marker legend. Code and output are shown below:
ods graphics / reset noscale noborder maxlegendarea=100 width=4in height=0.6in imagename='DiscreteAttrMapOnly_Marker'; proc sgrender data=sashelp.class template=DiscreteAttrMapOnly; dynamic _type='Marker'; run; run; |
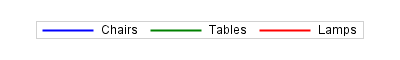
 Running this template with _type='Line' creates the line legend. Code and output are shown below:
ods graphics / reset noscale noborder maxlegendarea=100 width=4in height=0.6in imagename='DiscreteAttrMapOnly_Line'; proc sgrender data=sashelp.class template=DiscreteAttrMapOnly; dynamic _type='Line'; run; run; |
 Note, the DiscreteAttrMap can only be used in the DiscreteLegend with TYPE is specified. So, we can get just lines or just markers in the legend, but not both at the same time.
I believe the user wanted to do this to separate the legend from the graph, and just place the legend in a separate place. Regardless the actual usage, it was an interesting exercise.
It is likely, you could also do this by defining stand alone legend entries and adding these into a DiscreteLegend.
Full SAS 9.3 Code: DiscreteAttrMapLegendOnly


3 Comments
Thank you Sanjay! This is exactly what I was after! 🙂
Regards,
Kriss
Please see updated (simpler) template code.
Thank you!