All Posts


In 2011-2012, North Carolina became one of many states to restructure their educator evaluation system to incorporate student growth. The NC Department of Public Instruction commissioned the external expertise of WestEd to evaluate various growth models and recommend value-added technology that would help them best meet their mission of using meaningful evaluation to


For all of you whipper snappers (a loving term applied to generations younger than yourself) who haven't been around SAS since the beginning of time - like Phil Miller, Art Carpenter and Kathy Council have - you may not remember when SAS Users Groups conference proceedings weren't offered online. That's right

I often use the SAS/IML language for simulating data with certain known properties. In fact, I'm writing a book called Simulating Data with SAS. When I simulate repeated measurements (sometimes called replicated data), I often want to generate an ID variable that identifies which measurement is associated with which subject

Many of you know Mike Zdeb. He's a long-time SAS user and frequent presenter at SAS conferences. Zdeb is also a reviewer of many SAS Press books and author of his own SAS book, Maps Made Easy Using SAS. Zdeb contacted me after he read the May SAS Tech Report

The Swiss army knife is known for its versatility, with a variety of tools and blades to help you complete the task at hand. When you are creating graphics, you sometimes have a special feature you want to add, but you can't seem to find the right syntax "tool" to

According to Janet Stuelpner and Joseph Hantsch, the authors of the 2012 SAS Global Forum paper, One at a Time; Producing Patient Profiles and Narratives, patient profiles are used several ways depending upon the 'customer' need.
A reader wrote for help with a computational problem. He has a vector of length N and the vector contains integer values in the range [1, 120], which represent months for which events occurred over a 10-year period. The question is: what is the 24-month period for which the most


Can you actually get something for nothing? With PROC SQL’s subquery and remerging features, yes, you can. Often there is a need to add group descriptive statistics such as group counts, minimum and maximum values for further by-group processing. Instead of first creating the group count, minimum or maximum values
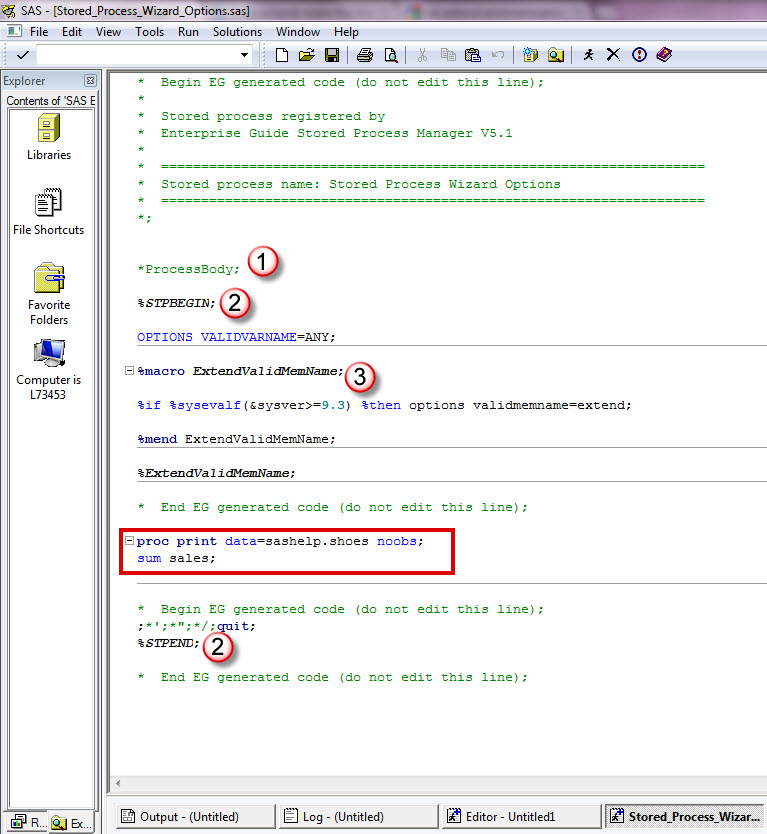

Wizard Harry Potter makes magic just waving his wand around and shouting out spells. Using SAS Enterprise Guide (and you are welcome to shout out your own commands too) you can create some magic, allowing the Stored Process Wizard to code for you. On Step 2, the "Include code for"

Statistical graphs often include display of derived statistics along with the raw data. Often these statistics are presented in a tabular format inside the graph. With SGPLOT procedure, a table of statistics can be added to the graph as an inset table, as shown below. Using a Stat Table: SGPLOT code:

The first time that I saw a demonstration of SAS Visual Analytics Explorer was awesome, but it didn't give me goosebumps. I got goosebumps the size of golfballs during SAS Global Forum Opening Session when Dr. Goodnight sat down at a computer screen and began to demonstrate how effortlessly users can
ODS Graphics components like GTL and SG procedures are designed to work with Styles to create graphs that are effective in the delivery of information and aesthetically pleasing out of the box. You no longer have to tweak the colors to ensure a nice graph. The graph derives all the


A colleague was recently working with a web service that supplies some datetime values using the Microsoft Windows internal representation. He called the web service to retrieve those values (along with other data) from SAS, and he needed convert these values to SAS date-time values. The Microsoft definition for a


When I was growing up, summertime always meant a road trip to see my grandparents and great-grandparents in Concord, California, just outside San Francisco. Most of our time in Concord was spent shuffling between relatives but my parents always made time for a day trip into San Francisco. On these
When the IASUG conference founder and 2012 co-chair John Xu was asked what makes this one-day event so successful year after year, he said, “The most important factor is the leadership. We are lucky that we have core conference volunteers committed to supporting the conference.”