All Posts


Watching our nation approach the "fiscal cliff", and the dire predictions if we truly drive off it like the last scene in Thelma and Louise, has sharpened my view of the potential risks that huge gaps of fraud and abuse present to all of us. One of the key lessons
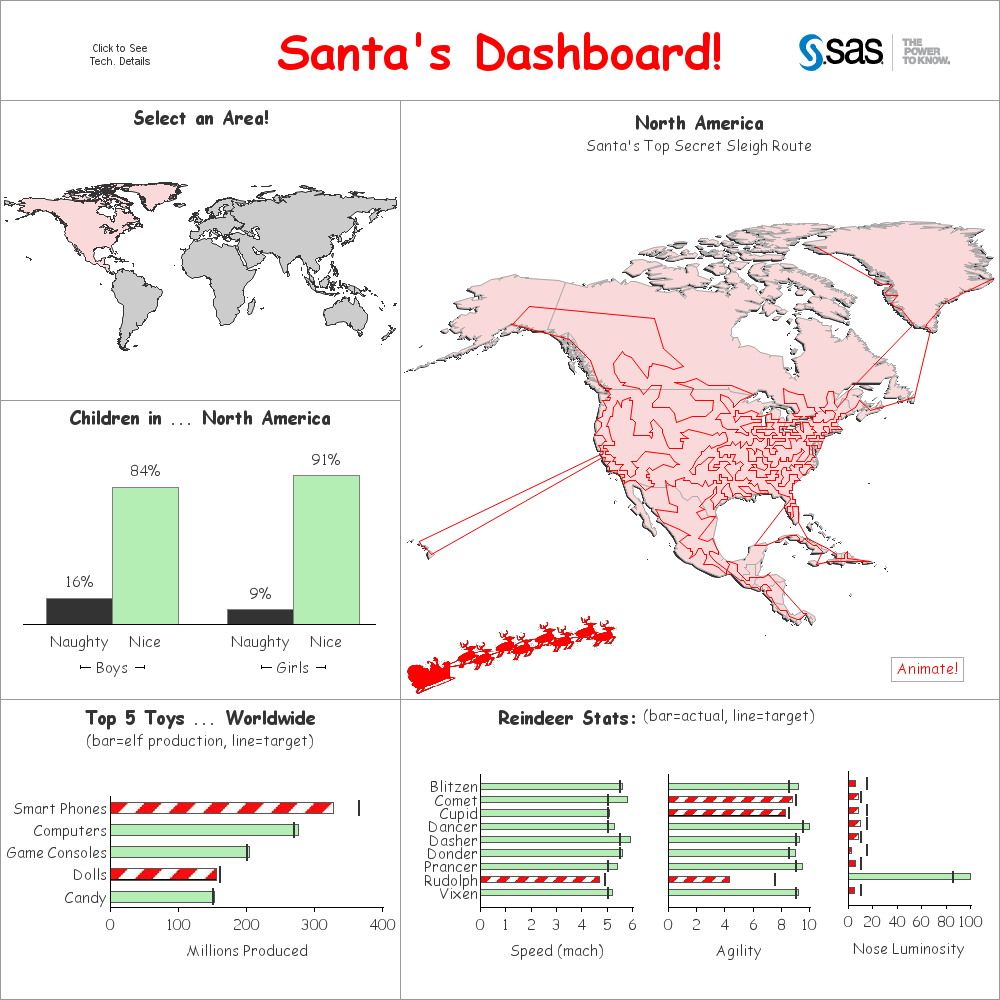

'Twas the week before Christmas, and all through the world ... dot-matrix printers were humming as Santa's naughty/nice list was unfurled... Can you imagine what it must have been like years ago when Santa had to maintain his naughty/nice list by hand, with a feather quill pen?!? Or even these

The SGPANEL procedure is used to create panelled graphics based on classification variables. The panelled cells are generated starting from either the top left (the default) or the bottom left of the panel, controllable by the START option. Currently, the ordering of the cells is determined by two criteria: 1.


Yao Huang says that you can use the %mock_table SAS macro to build mock tables needed for Phase I clinical trials. "Instead of spending a lot time to create or modify each table using a word processor, statisticians or programmers can quickly run this macro using a pre-specified excel template


Once you have submitted your abstract for SAS Global Forum, the wait is on! It can be very grueling, especially for first time presenters who don’t know the ropes yet. The key is not to second guess yourself or your idea. The wait can be long, weeks or even months,


Police Departments across the country are under constant scrutiny by elected officials, the media and the public to reduce crime, control costs, engage the public, always be accessible and, most important, always be courteous and professional. Police departments that demonstrate excellence in these areas can achieve accreditation by The Commission
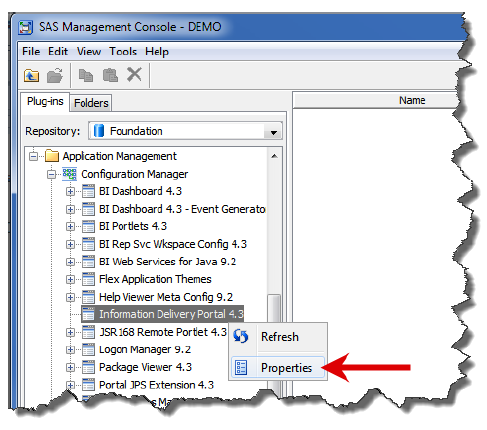

All users must first enter a user name and password to view portal pages and other content. In prior releases of SAS Information Delivery Portal, the Public Kiosk owned by internal SAS user SASGUEST was available to present users with a single screen that could include any content the organization
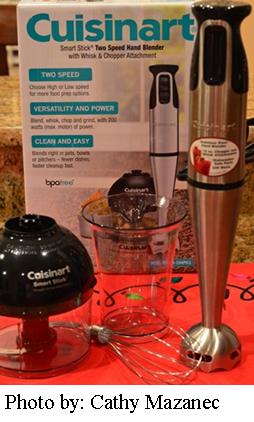

I recently heard morning radio DJs talking about things people would never want to receive as holiday gifts. One of the categories they mentioned was kitchen appliances. Giving kitchen tools and appliances as gifts may be frowned upon by some but for the foodies in your family, culinary utensils can stir squeals

Naomi Robbins has posted a contest, part 1 of which is to submit alternative representations for the following graph: Clearly, usage of two pie charts to represent the share of the B2B and B2C referrals will invite many responses. To create the graph, I took the data shown in the Pie Charts themselves, so we are using percent

We’ve already heard from more than 900 SAS users! Now we need to hear from you!

Several years ago my mom, bless her heart, bought a cell phone. Now, my mom is not what one would call “tech-savvy”. She has had the same car forever, same furniture for 25 years (well, she did get it reupholstered), even the same pots and pans that came as wedding
With an exponential growth in transactions, it may be hard to get a clear, single view of customer interactions. ICICI Bank , India's second largest bank, needed a single system that could replace multiple (complex to maintain) reporting systems - enterprise wide. The challenge - finding a solution to handle its growing


As rain settles in over the green fields of England, I’ve been reading the Times Higher Education (THE) periodical. It’s always a lively read, as it invariably takes the part of untenured junior lecturers in any dispute. It is also very well researched and informed. This week’s THE edition has


When I started using SAS back in 1995, every SAS user was a SAS programmer. We wrote code, and we were proud of it! We accessed our data via the DATA step, PROC IMPORT and SAS access engine code. If you had asked me back then what metadata is, I’m
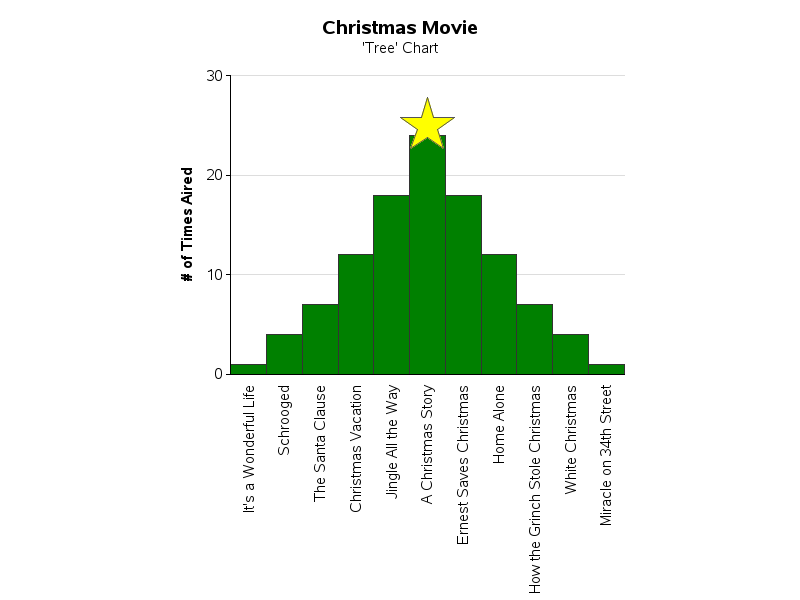
While I'm waiting for the next "data intense" event to show up in the news (so I can blog some SAS graphs about it), I thought I'd share a few fun SAS graphs in the spirit of the holiday season! Please don't hold me to too high of graphical "best practices"