All Posts

As you've probably guessed, I'm a "visual" person - I like to see things (in a chart/graph/map) rather than just reading about them (in a data table and summary statistic). Don't get me wrong - I'm a big fan of statistics and analytics -- but I'm an even bigger fan of

If you have been reading the articles in this blog, you already know that the Graph Template Language (GTL) forms the underlying foundation for all graphs produced automatically from SAS analytical procedures and custom graphs created with the SG Procedures and the ODS Graphics Designer. SG procedures and Designer provide


"Do I really need a detailed technical architecture before I start my SAS Deployment?" My team gets asked these questions all the time: Do we really need to spend the time for the above exercise? Why can’t we just start doing the deployment of SAS and fix issues if they come
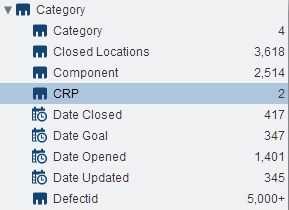

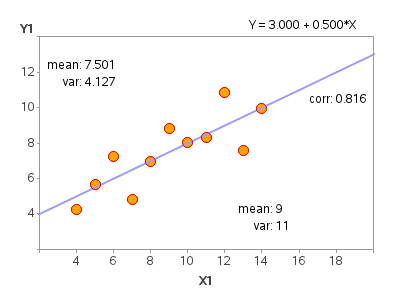
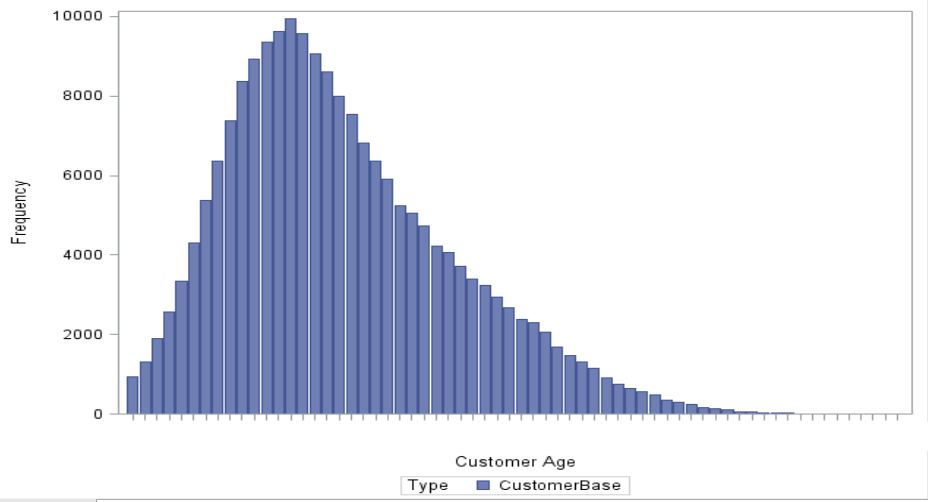
Data cardinality is an important topic for for data analysis. In mathematical terms, cardinality is simply the number of elements in a set. But in data applications, cardinality signifies the number of unique values for a given field of data. Related terms include number of levels (thank you, PROC FREQ

Don't ask me how it happened, but in my quest for even more SAS fame, I managed to muscle my way onto the set for Inside SAS Global Forum, the video series that focuses on everything that you need to know about SAS Global Forum 2014. After a brief cooling
Yesterday I read a Christina's blog article on the winners of the Best Presentations honor at MWSUG 2013. Two papers caught my (graphical) eye, both by Perry Watts. Perry has done a marvelous job describing how creatively use GTL to make graphs that may not be obvious at first glance.

If you know what this means, you’ll love our news! SAS Global Forum 2013 was the official “Year of the Poster”, and conference chair Rick Mitchell and his team more than tripled the number of poster submissions. Posters are indispensable for visual content. Poster presentations are also a huge asset

My aunt Susanne is an elderly lady, who lives at the countryside and looks forward to celebrating her 80th birthday soon. Since the 1960's she has had a telephone connection with her fixed line provider. At that time, and for many years later, in the country where my aunt lives,

Congratulations to Best Paper Winners from MidWest SAS Users Group conference! You'll want to read these, and check the MWSUG 2013 proceedings for other useful papers from the recent conference. Start planning now for MWSUG 2014 in Chicago.

Recently I delivered a SAS Talks session: SAS 9.4: What’s New for SAS® Administrators . We had a large group attend and subsequently had a wonderful flood of questions that we couldn’t always keep up with. So I wanted to follow up with some of the popular questions:


The herbs and spices we use to flavor our foods can have powerful health benefits. Along with cinnamon and ginger, one of the most potent spices we have in our kitchen is turmeric. Turmeric is a bright yellow spice commonly found in curry powder (typically a mixture of coriander, cumin, fennel, mustard
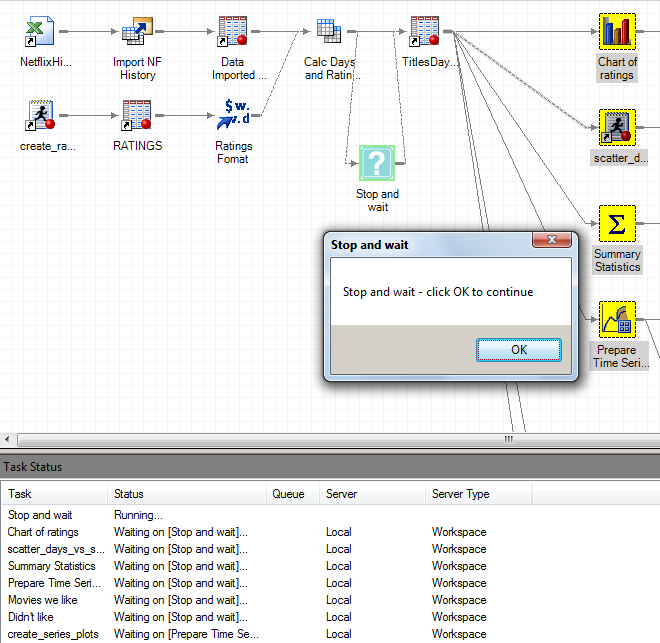
Traditionally, SAS users like their processes to behave like Ron Popeil's famous rotisserie: they want to set it and forget it. That's the definition of a batch process. You work like heck to get it ready to run, then you push the button (or schedule it) and walk away. But

This year, SAS users are flocking to the Western Users of SAS Software’s (WUSS) annual conference. I had a chance to catch up with Operations Chair MaryAnne DePesquo, and she shared her excitement about this year’s conference. This is the first year that WUSS will be hosted in Las Vegas
Energetic. Content Rich. Powerful. That's how I describe the upcoming conference. We have a great presentation lineup and new opportunities for you to take advantage of. Register now and reserve your seat today! Here are a few of our confirmed speakers: A two-time winner of the USA Memory Championship, Nelson


What is the best way to share SAS/IML functions with your colleagues? Give them the source code? Create a function library that they can use? This article describes three techniques that make your SAS/IML functions accessible to others. As background, remember that you can define new functions and subroutines in