 Frequently you may want to modify the default colors, line patterns and symbols that are displayed on the graphics output produced by the Statistical Graphics, or SG procedures, and the Graph Template Language, GTL. Enhancements in SAS 9.4 have made that task much easier!
In the examples below, we will look at the code that accomplishes this when you have a GROUP variable in your plotting statement. The syntax described in this blog is supported for PROC GPANEL, PROC SGPLOT and PROC SGRENDER beginning in SAS 9.4.
Before getting started, we need to sort our data set, SASHELP.CLASS, by the GROUP variable.
proc sort data=sashelp.class out=class;
   by sex;
 run;
Modifying SGPLOT style—SAS 9.2 and SAS 9.3
If you’re using releases prior to SAS 9.4, this step requires modifying an existing style definition with PROC TEMPLATE. The style definition contains a CLASS statement for every value of the GROUP variable.
In the example below, the style definition defines that the color for the first group value will be orange with a line style of 1 and that the marker symbol will be circlefilled. For the second group, the color used is purple, the line style is 1 and the marker symbol is trianglefilled. In addition to the style definition, the STYLE option is specified on the ODS HTML statement pointing to the new style we have created.
/* define colors, line patterns and marker symbols for the regression plot */
proc template;
  define style mystyle;
  parent=styles.htmlblue;
    class GraphData1 /
          contrastcolor=orange linestyle=1 markersymbol='circlefilled';
    class GraphData2 /
          contrastcolor=purple linestyle=1 markersymbol='trianglefilled';
  end;
run;

/* point to the style definition with STYLE option on the ODS html stmt */

ods _all_ close;
ods html file='test.html' path='.' (url=none) style=mystyle;
proc sgplot data= class;
  reg x=weight y=height / group=sex degree=3;
run;
ods html close;
Modifying SGPLOT style—SAS 9.4
Beginning in SAS 9.4, you can define the style attributes with the STYLEATTRS statement. On this statement the DATACOLORS, DATACONTRASTCOLORS, DATALINEPATTERNS and DATASYMBOLS options specify the fill colors, line colors, line style and marker symbols respectively. Since we have defined these attributes on the STYLEATTRS statement, we can remove the style definition, and we can remove the STYLE option from the ODS HTML statement.
ods html file='test.html' path='.' (url=none);
proc sgplot data= class;
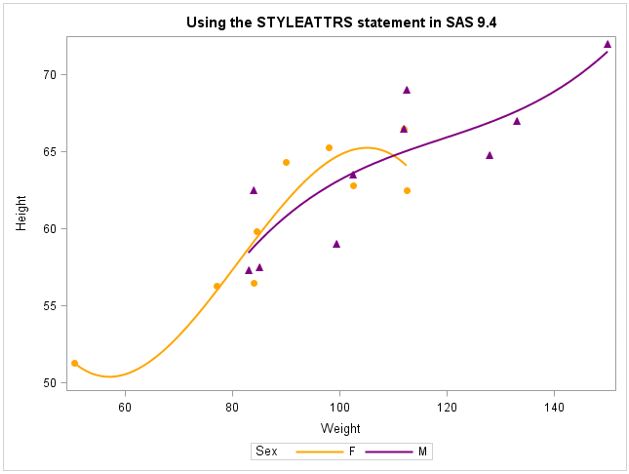
title 'Using the STYLEATTRS statement in SAS 9.4';
styleattrs datacontrastcolors=(orange purple) datalinepatterns=(1)
datasymbols=(circlefilled trianglefilled);
reg x=weight y=height / group=sex degree=3;
run;
ods html close;Below is the graph that is produced from the above program:
Modifying the style with GTL – SAS 9.2 and SAS 9.3
If you are using the Graph Template Language, GTL, to create your graph prior to SAS 9.4, you need to define the style attributes for the colors, interpolation and marker symbols in a style definition using PROC TEMPLATE. The style definition can go directly after your GTL definition.
proc template;
 define statgraph reggraph;
 begingraph;
    layout overlay;
       regressionplot x=weight y=height / group=sex degree=3 name='reg';
     scatterplot x=weight y=height  /group=sex;
     discretelegend 'reg';
    endlayout;
 endgraph;
 end;

 /* define colors, line patterns and marker symbols for regression plot */
 define style mystyle;
    parent=styles.htmlblue;
        class GraphData1 /
           contrastcolor=orange linestyle=1 markersymbol='circlefilled';
        class GraphData2 /
           contrastcolor=purple linestyle=1 markersymbol='trianglefilled';
  end;
run;

/* point to style definition with the STYLE option on the ODS html stmt */
ods _all_ close;
ods html file='reg.html' path='.' style=mystyle;
proc sgrender data=class template=reggraph;
run;
ods html close;
Modifying the style with GTL - SAS 9.4
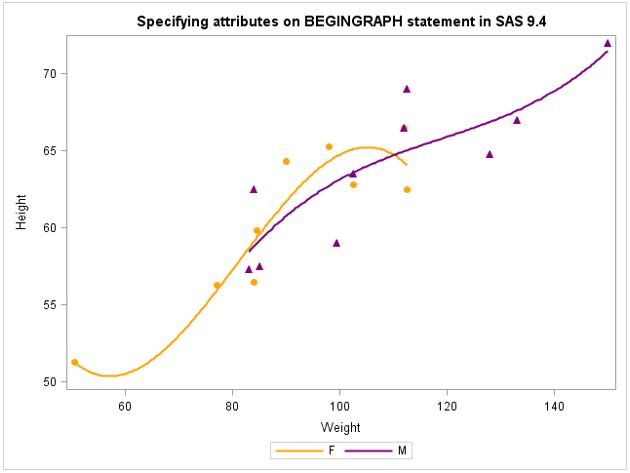
Beginning in SAS 9.4, the style attributes can be defined on the BEGINGRAPH statement with the options: DATACOLORS, DATACONTRASTCOLORS, DATALINEPATTERNS and DATASYMBOLS. The DATACOLORS option specifies the fill colors, the DATACONTRASTCOLORS option specifies the contrast colors, the option DATALINEPATTERNS defines the line style and DATASYMBOLS defines the marker symbols. The sample code below illustrates the syntax.
proc template;
 define statgraph reggraph;
 begingraph / datacontrastcolors=(orange purple) datalinepatterns=(1)
                datasymbols=(circlefilled trianglefilled);
 entrytitle 'Specifying attributes on BEGINGRAPH statement in SAS 9.4';
    layout overlay;
       regressionplot x=weight y=height / group=sex degree=3 name='reg';
     scatterplot x=weight y=height  /group=sex;
     discretelegend 'reg';
    endlayout;
 endgraph;
 end;

ods html file='reg.html' path='.';
proc sgrender data=class template=reggraph;
run;
ods html close;
Below is the graph that is generated from the above program:

11 Comments
You can specify the colors for the band fill with the DATACOLORS option on the STYLEATTRS statement in PROC SGPLOT. For example:
styleattrs datacolors=(green orange) datacontrastcolors=(blue red);
I am using sgplot with a band statement and a series statement. Both statements have the same group= option included. (I have two groups) So there will be two lines and two bands overlaid on my plot. I can get the two lines to be different colours using the styleattrs statement. But how can I control the fill attributes for the band statement to be different for the different groups rather than just leave it to the procedure?
thanks.
Good informative article.
But in proc sgpanel, if we are using panelby statement so in that case how to assign two different color lines for two treatment (i.e. Blue for test and red for placebo) for all subjects?
My code:
proc sgpanel data=trend NOAUTOLEGEND ;
panelby Treatment / layout=columnlattice novarname colheaderpos=bottom SPACING= 3 nowall ;
styleattrs DATACOLORS=(blue red) datacontrastcolors=(blue red) ;
vline visit / response=tgauc group=ENNUM LINEATTRS=(pattern=1) markers FILLEDOUTLINEDMARKERS MARKERATTRS=(symbol = circlefilled) ;
run;
Above code gives assigned colors to group= option but not to the variable of panelby statement.
I don't have 9.4 yet. I see I am going to need a translation table from the attribute keywords used in the template to those used in styleattrs. Why aren't they the same? Why make SAS even more complex and inconsistent?
Nice technique Lelia. I am just learning to use PROC TEMPLATE. One question I have is that when I ran your code my output did not have the triangles for the males, instead it use circles. It seems that what ever shape I use in the first GraphData becomes the only shape that is used. Any idea why?
BTW I have SAS 9.3
Cheers
Patrick
Thanks for bringing this to my attention. The defaults changed along the way. You will need to add the statement:
class graph / attrpriority='none';
to your template definition. When you get a chance modify your TEMPLATE definition so it looks like this:
proc template;
define style mystyle;
parent=styles.htmlblue;
class graph / attrpriority='none';
class GraphData1 /
contrastcolor=orange linestyle=1 markersymbol='circlefilled';
class GraphData2 /
contrastcolor=purple linestyle=1 markersymbol='trianglefilled';
end;
run;
this is very helpful. It provides the solution for the problem that I have been trying to resolve for the past week. Thanks!
Glad to hear this information helped you with your application!
Below is sample code that illustrates how to define the color for each group when creating a bar chart with PROC SGPLOT in SAS 9.4. Note that in this example, the DATACOLORS parameter is used to define the fill color for each group.
proc sgplot data=sashelp.class;
styleattrs datacolors=(pink cyan);
vbar age/group=sex;
run;
There is a third method for specifying data attributes: The DATTRMAP= option on the PROC SGPLOT statement. For an overview and example, see the article "Specify the colors of groups in SAS statistical graphics."
Nice tips. Yet more motivation to get 9.4. Recently I've become a big fan of the %modstyle() macro SAS provides. For folks not intimately familiar with style template ins and outs, it's an easy way to create a new style template with the desired attributes. And not only is the macro useful, looking into the macro code itself, it's very well written, and exceptionally well documented. Quite impressive. This paper describes the use. http://support.sas.com/rnd/app/ODSGraphics/papers/modtmplt.pdf