All Posts

Creating a Bar Chart with a table of statistical data aligned with the bars is a popular topic. With SAS 9.4, creating such graphs gets easier with the new AXISTABLE statement in GTL and SG procedures. But some use cases can flummox the latest gizmos. Such is the case I ran into recently. Here
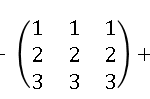

Recently a SAS/IML programmer asked a question regarding how to perform matrix arithmetic when some of the data are in vectors and other are in matrices. The programmer wanted to add the following matrices: The problem was that the numbers in the first two matrices were stored in vectors. The

Data on punched-cards, SAS software delivered on tape, jobs in the queue on the mainframe, printouts on green-bar paper ... we really appreciate all our SAS users, but if any of the above are part of your "SAS memories" we especially appreciate you! I guess I'm a computer geek, because
Last week I covered some of the interesting graph-related papers presented at WUSS. There were quite a few, so I broke up the report into two parts. Here is the second installment. In the paper Creating Graphical Patient Profiles using SAS by William Garner of Gilead Sciences, the author describes how to create


Pomegranates are popping up everywhere and are in everything from ice cream and rice cakes to body wash and even candles! So what’s the big deal about pomegranates?

When learning a new language, it is important to learn to interpret error messages that come from the language's parser or compiler. Three years ago I blogged about how to interpret SAS/IML error messages. However, many questions have been posted to the SAS/IML Support Community that indicate that some people
It is always a pleasure to attend SAS user conferences, regional conferences and in-house events. In addition to presenting papers, seminars and super demos to the attendees myself, my favorite activity is to attend presentations by users that include graphical data visualization. These include using SG procedures, GTL, Designer or SAS/GRAPH. This year
Each year my siblings choose names for a Christmas gift exchange. It is not unusual for a sibling to pick her own name, whereupon the name is replaced into the hat and a new name is drawn. In fact, that "glitch" in the drawing process was a motivation for me


As the “Year of Statistics” comes to a close, I write this blog in support of the many statisticians who carefully fulfil their analysis tasks day by day, and to defend what may appear to be demanding behavior when it comes to data requirements. How do statisticians get this reputation? Are we
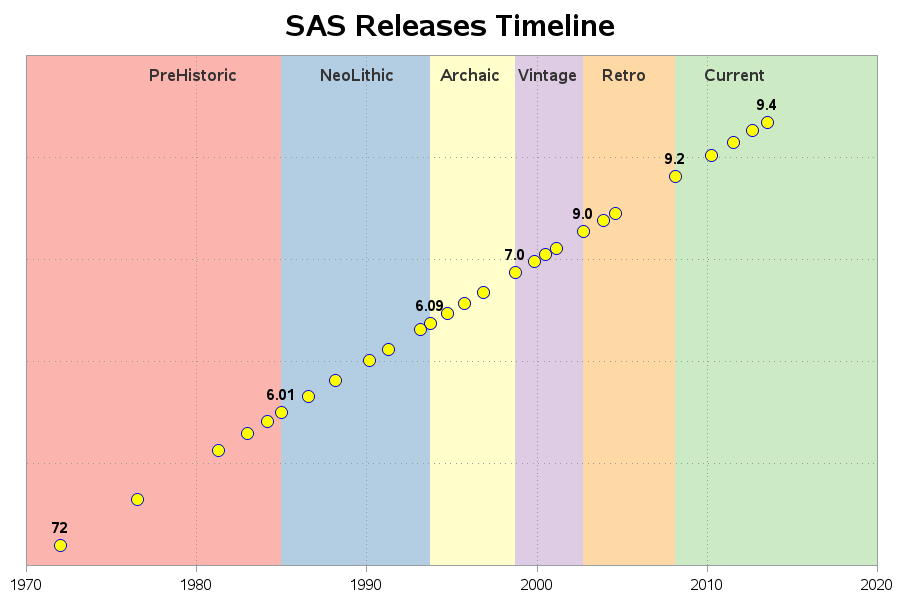
There are 2 kinds of people in the world -- those who dread change, and those who look forward to it. Which kind of person are you, when it comes to upgrading your SAS software?!? With most software (such as Windows OS, Facebook, Gmail, etc) I tend to fall into


Another day, another scam defrauding insurers and governments. For purposes of full disclosure, the case I'm highlighting today comes from Washington's Labor and Industries (L&I), the agency where I formerly worked and headed up fraud prevention efforts, and the investigation dates back to my time there. During my time there,
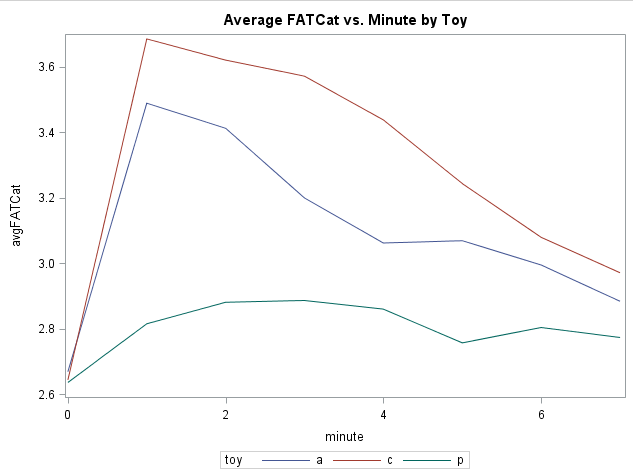

“Dear Cat, In a repeated measures drug study, I am unsure what to do with the baseline measurement. Since it is one of the time points in my study, I feel like I should use it as one of the dependent variable measurements. But I have seen analyses where baseline
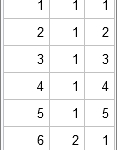
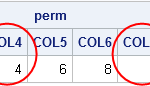
If you write an n x p matrix from PROC IML to a SAS data set, you'll get a data set with n rows and p columns. For some applications, it is more convenient to write the matrix in a "long format" with np observations and three columns. The first
In recent conversations with many SAS users at NESUG, SESUG and WUSS, a pattern emerges on the question of creating graphs with SAS or R. Many SAS users are aware of the new graph features in SAS that create high quality graphs with minimum fuss. But, many have not actually used

Are you in the market for a new car? Perhaps you are researching how the various parameters of cars match up to each other? Well, in SAS 9.4 Maintenance 1 release, ODS Graphics will support a new versatile plot: the polygon plot. As the name suggests, it lets you draw