All Posts


Last week's SAS Talks session, My Favorite SAS Enterprise Guide 5.1 Tricks, was remarkable in several ways. First, the featured presenter was Marje Fecht, who also serves as the conference chair for SAS Global Forum 2014. She's an avid SAS professional who loves to educate her fellow SAS users on
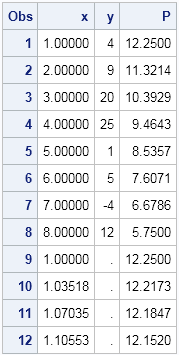

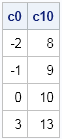
A fundamental operation in statistical data analysis is to fit a statistical regression model on one set of data and then evaluate the model on another set of data. The act of evaluating the model on the second set of data is called scoring. One of first "tricks" that I

Browsing graphs on the web, this graph caught my eye: The Arctic Sea Ice Volume Graph. My interest is not so much in the debate on Climate Change or Global Warming. To me, this graph has some interesting features that can help show the benefits of plot layering to
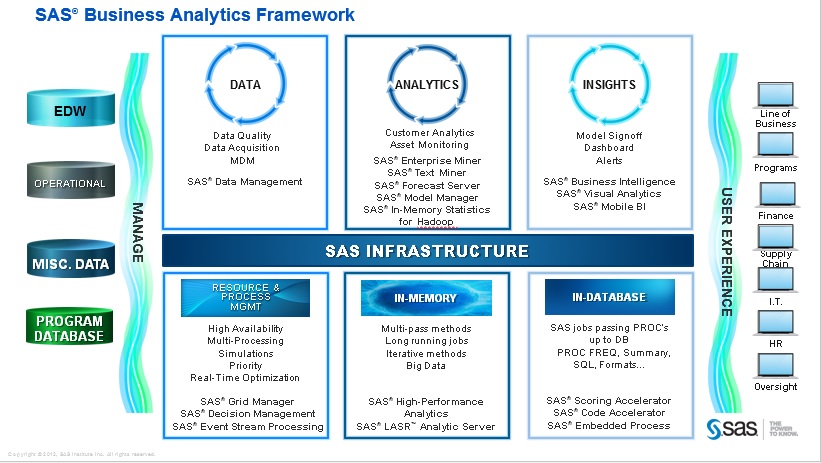

I was recently part of team discussing enterprise architecture with a chief IT architect, and we were explaining how SAS can integrate into their existing infrastructure, add business value on top it and even fit into their future planned infrastructure. This conversation was one of the reasons I blogged about


Dylan Jones says one way to improve data accuracy is to increase the frequency and quality of reality checks.
The attention of the world is now on Sochi and the Winter Games. Gold, Silver and Bronze medals are being earned by these amazing athletes, and everyone has an eye on the tally. Andre sent me a link to TRinker's R Blog, showing a graph of the current tally. Andre


Valentine’s Day is one of those make-or-break holidays for gift retailers. They are selling "nice to have" items, not necessities. Many use some type of analytics to segment customers for personalized messages. It's not as straightforward as it sounds, especially if the organization hasn't committed to an enterprise-wide approach to


Here in the SAS Performance Lab, we’re seeing more and more SAS sites moving their SAS® 9 application workloads to Windows Server 2012. Now that we’ve had sufficient time to gather feedback from early implementers of SAS on these systems, we thought you might want a recap of some of
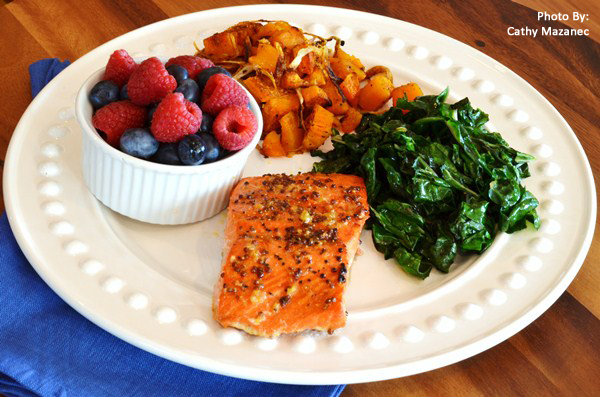

No doubt many folks feel an energy slump in the winter months. Short days and long nights plus the added drain of gray or rainy days can dampen our spirits. Did you know certain nutrients may help calm anxiety or boost your spirits? If you feel a drop in your
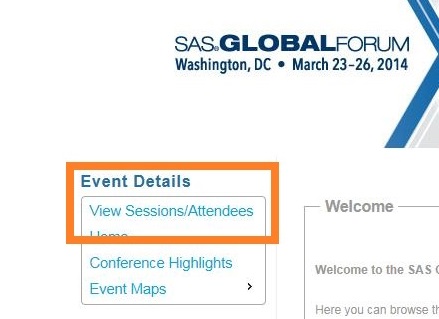

Hopefully, you’ve listened to SAS Global Forum 2014 Conference Chair Marje Fecht talk about the focus on content at this year’s conference. The Conference Scheduler is central to achieving that goal, helping you easily find and schedule the presentations, tutorials and activities that meet your needs and interests. In this
One of my favorite new features of SAS/IML 12.1 enables you to define functions that contain default values for parameters. This is extremely useful when you want to write a function that has optional arguments. Example: Centering a data vector It is simple to specify a SAS/IML module with a
One of the most popular graph amongst clinical and pharmaceutical users is the Survival Plot as created from the LIFETEST Procedure. This is one graph that users most often want to customize. See Creating and Customizing the Kaplan-Meier Survival Plot in PROC LIFETEST - Warren F. Kuhfeld and Ying So, SAS Institute
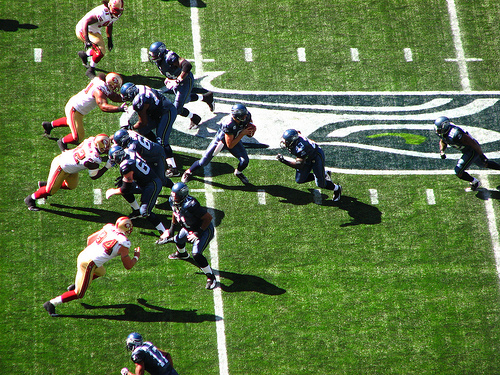
When the Seattle Seahawks won the Super Bowl, they didn’t do it because of just one factor – a great quarterback or an amazing running back. It was widely considered a team effort, helmed by a visionary coach who worked on developing a strong culture, cultivating the right players and


I'm a big believer in both/and thinking, so I'll stand squarely in the middle and say that the most important skills for competitive advantage in analytics include a combination of top-notch modeling abilities along with business acumen, critical thinking, and curiosity. I was intrigued by a blog post on this
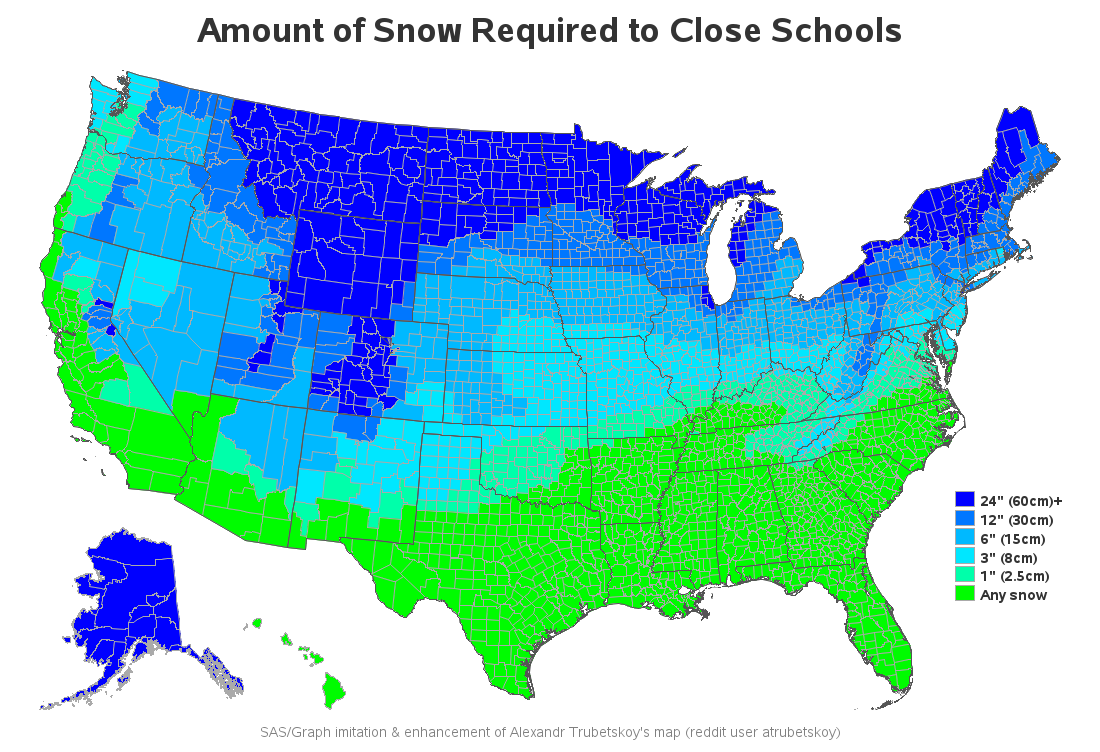

We get very little snow in Wake County, NC (SAS Headquarters) - therefore when we do have snow, it's a big deal and they close the schools. Which made me wonder ... how much snow does it take to close schools in the rest of the US? Last week we got our