One of the most popular graph amongst clinical and pharmaceutical users is the Survival Plot as created from the LIFETEST Procedure. This is one graph that users most often want to customize. See Creating and Customizing the Kaplan-Meier Survival Plot in PROC LIFETEST - Warren F. Kuhfeld and Ying So, SAS Institute Inc.
The original graph template was created using SAS 9.2 feature set. With SAS 9.3 and SAS 9.4, we have added new features to make creating such graphs easier. Let us see how you can do this, given the data needed to create the graph. As you will see in the attached full program code at the bottom, I have run the example 49_2_1 from the documentation for the LIFETEST procedure to create the data set necessary for the graph Here is a snippet of the output data set.
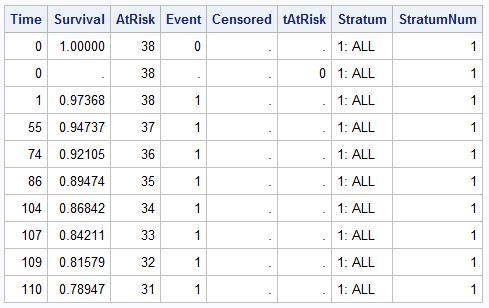
The data set has data for Survival by Time by Stratum. The data set also contains separate columns for the AtRisk values and the tAtRisk. We will use these columns to create the graph.
Using SAS 9.3, creating the basic graph of the survival curves showing survival by time by stratum is straightforward. This can easily be done using SGPLOT, but since we want to add the At-Risk values, let us use GTL. Here is the graph and the GTL code. Click on the graph for a high resolution image.
SAS 9.3 Graph of Survival Curves with legends:

SAS 9.3 GTL code:
proc template; define statgraph SurvivalPlot; begingraph; entrytitle 'Product-Limit Survival Estimates'; layout overlay / yaxisopts=(linearopts=(viewmin=0)); stepplot x=time y=survival / group=stratum lineattrs=(pattern=solid) name='s'; scatterplot x=time y=censored / markerattrs=(symbol=plus) name='c'; scatterplot x=time y=censored / markerattrs=(symbol=plus) GROUP=stratum; discretelegend 'c' / location=inside halign=right valign=top; discretelegend 's'; endlayout; endgraph; end; run; proc sgrender data=SurvivalPlotData template=SurvivalPlot; run; |
As expected, we have used a STEPPLOT statement to plot the survival by time by stratum. Two scatter plots are used to overlay the censored observations. One without group is used to include in the inner legend. The second one with group overlays on the first, and displays the same markers with color. The step plot is included in the legend at the bottom of the graph.
Now, let us add the display of the AtRisk values to this graph. This can be done in different ways. First, let us use the BLOCKPLOT in an INNERMARGIN of the graph itself.
SAS 9.3 Survival Plot with AtRisk Values inside the plot:

SAS 9.3 GTL code:
proc template; define statgraph SurvivalPlotAtRisk_Inside; begingraph; entrytitle 'Product-Limit Survival Estimates'; entrytitle 'With Number of AML Subjects at Risk' / textattrs=(size=8); layout overlay / yaxisopts=(linearopts=(viewmin=0)); stepplot x=time y=survival / group=stratum lineattrs=(pattern=solid) name='s'; scatterplot x=time y=censored / markerattrs=(symbol=plus) name='c'; scatterplot x=time y=censored / markerattrs=(symbol=plus) GROUP=stratum; referenceline y=0; innermargin; blockplot x=tatrisk block=atrisk / class=stratum display=(values label) valuehalign=start valueattrs=(size=8) labelattrs=(size=8); endinnermargin; discretelegend 'c' / location=inside halign=right valign=top; discretelegend 's'; endlayout; endgraph; end; run; |
Note in the graph above, the At-Risk values are displayed closer to the curves, without any distracting axis and legends between the values and the curves. This is actually better for decoding of the information requiring less eye movement to line up the values.
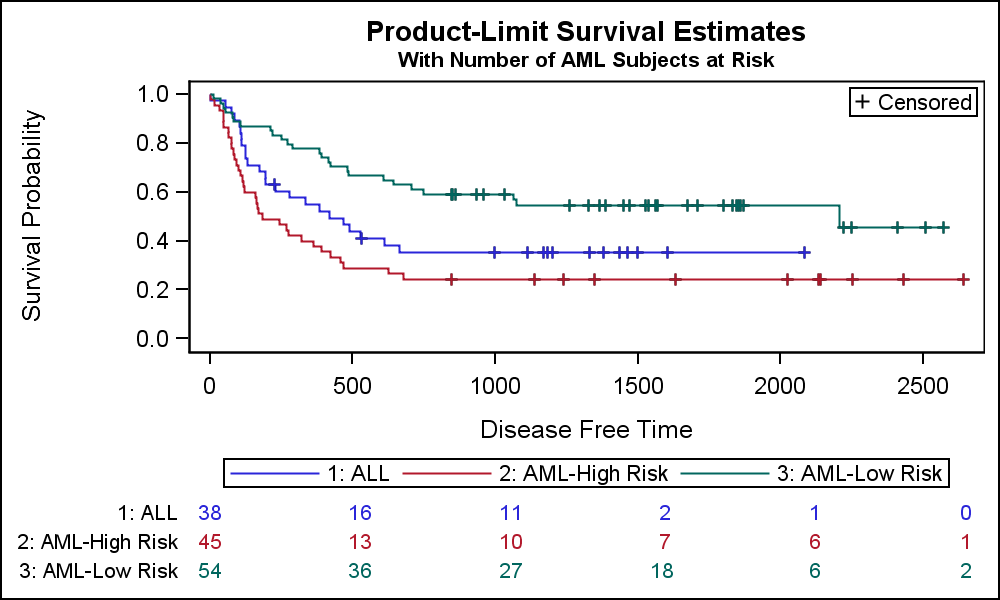
However, it is noted that the standard practice in the industry is to place the AtRisk table values outside the graph, below the x axis and the legend. This is easily done using the following modification of the GTL code shown below.
SAS 9.3 Survival Plot with AtRisk Values outside the plot:
SAS 9.3 GTL code:
proc template; define statgraph SurvivalPlotAtRisk_Outside_Scatter; begingraph; entrytitle 'Product-Limit Survival Estimates'; entrytitle 'With Number of AML Subjects at Risk' / textattrs=(size=8); layout lattice / columns=1 rowweights=(0.83 0.17) rowgutter=10; layout overlay / yaxisopts=(linearopts=(viewmin=0)); stepplot x=time y=survival / group=stratum lineattrs=(pattern=solid) name='s'; scatterplot x=time y=censored / markerattrs=(symbol=plus) name='c'; scatterplot x=time y=censored / markerattrs=(symbol=plus) GROUP=stratum; discretelegend 'c' / location=inside halign=right valign=top; discretelegend 's'; endlayout; layout overlay / xaxisopts=(display=none) walldisplay=none yaxisopts=(display=(tickvalues) tickvalueattrs=(size=8)) ; scatterplot x=tatrisk y=stratum / group=stratum markercharacter=atrisk markercharacterattrs=(size=8); endlayout; endlayout; endgraph; end; run; |
Note a few features of this program:
- We have now used a LAYOUT LATTICE as an outer container, with two ROWS.
- The ROWWEIGHTS have been set to 0.87 and 0.13. This is required to customize the row heights.
- We have used the SCATTER plot with MarkerCharacter option to draw the At-Risk values. One benefit is the use of the GROUP=Stratum, so the values and labels are colored by the same stratum values for easier association between the curves and the values. We can even remove the bottom legend. Note, while the values are colored, the labels are not.
- We can use the ROWGUTTER to control the spacing between the table and the legend.
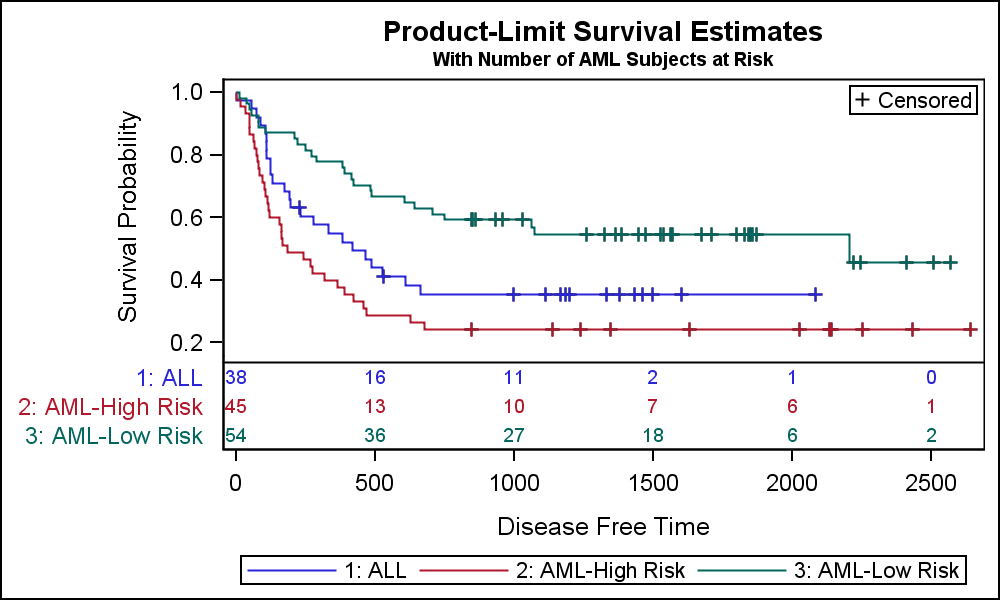
Now, let us see how much easier this is using the new AXISTABLE feature in SAS 9.4. The AXISTABLE is a new statement in GTL and SGPLOT that makes is easy to display tables of axis aligned data. We can create the same graph using the SAS 9.4 SGPLOT procedure with the AXISTABLE.
SAS 9.4 SGPLOT Survival Plot with inside table using AXISTABLE:
SAS 9.4 SGPLOT Code:
title 'Product-Limit Survival Estimates'; title2 h=0.8 'With Number of AML Subjects at Risk'; proc sgplot data=SurvivalPlotData; step x=time y=survival / group=stratum lineattrs=(pattern=solid) name='s'; scatter x=time y=censored / markerattrs=(symbol=plus) name='c'; scatter x=time y=censored / markerattrs=(symbol=plus) GROUP=stratum; xaxistable atrisk / x=tatrisk class=stratum location=inside colorgroup=stratum separator; keylegend 'c' / location=inside position=topright; keylegend 's'; yaxis min=0; run; |
Note, the XAXISTABLE is placed inside the graph, in the INNERMARGIN as shown earlier. Both the at risk values and the labels outside the Y axis are color coded by stratum. The order of rows is right by default and a separator is used between table and graph.
SAS 9.4 SGPLOT Survival Plot with outer table using AXISTABLE:
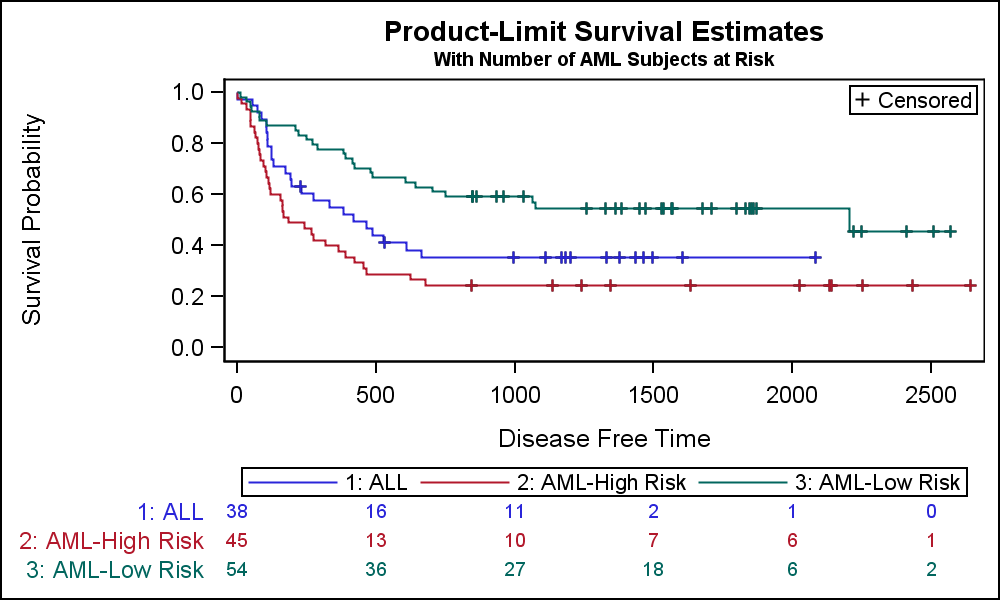
title 'Product-Limit Survival Estimates'; title2 h=0.8 'With Number of AML Subjects at Risk'; proc sgplot data=SurvivalPlotData; step x=time y=survival / group=stratum lineattrs=(pattern=solid) name='s'; scatter x=time y=censored / markerattrs=(symbol=plus) name='c'; scatter x=time y=censored / markerattrs=(symbol=plus) GROUP=stratum; xaxistable atrisk / x=tatrisk class=stratum location=outside colorgroup=stratum; keylegend 'c' / location=inside position=topright; keylegend 's'; yaxis min=0; run; |
Note, here the XAXISTABLE is placed outside the graph. Both the at risk values and the labels outside the Y axis are color coded by stratum. The order of rows is right by default.
Full code for Survival Plot: Survival


10 Comments
Sanjay, I have additional updates if you would like to take a look. Talking with you last year at PharmaSUG gave me great ideas for quick customizations.
I would love to. Where do I see your latest work?
Sanjay - Thank you very much! Proc Lifetest is not just for Pharmco anymore. It can be used to look at attrition problems as well.
I am interested in customizing the survival curve for employment attrition. Is there a template for those of us who are math challenged? I would like to plug in numbers:
1. terminations directly hired
2. terminations by "X" staffing agent
3. terminations by "Y" staffing agent.
You could post your question on the Communities page for "SAS/GRAPH and ODS Graphics". Many expert SAS users are active on the page, and could provide useful ideas.
https://communities.sas.com/t5/SAS-GRAPH-and-ODS-Graphics/bd-p/sas_graph
In SAS 9.4 one can use datalinepatterns for black and white plots. I wish SAS had a datasymbols for simple censored marks as 'ticks' rather than the next best option, 'plus'.
Thank you for this page it helped me a lot.
=== on the data above ===
ods graphics on / ATTRPRIORITY=NONE;
title 'Product - Limit Survival Estimates';
title2 h=7pt 'nrsk - xaxistable statement - censored';
proc sgplot data=SurvivalPlotData CYCLEATTRS;
STYLEATTRS
datacolors=(red)
datacontrastcolors=(black)
datalinepatterns=(solid mediumdash dashdotdot)
datasymbols=(plus);
step x=time y=survival / group=stratum name='survival';
scatter x=time y=censored / group=stratum markerattrs=(symbol=plus size=2 mm);
keylegend 'survival' / down=3 location=inside position=topright;
xaxistable atrisk / x=tatrisk class=stratum title="n rsk" location=outside position=bottom
colorgroup=stratum
;
xaxis values=(0 to 2500 by 500 2700);
yaxis values=(0 to 1 by .1) offsetmin=0.1 min=0;
run;
title;
ods graphics on / ATTRPRIORITY=NONE;
title 'Product - Limit Survival Estimates';
title2 h=7pt 'nrsk - xaxistable statement - no censored mark';
proc sgplot data=SurvivalPlotData CYCLEATTRS;
STYLEATTRS
datacolors=(red)
datacontrastcolors=(black)
datalinepatterns=(solid mediumdash dashdotdot)
datasymbols=(plus);
step x=time y=survival / group=stratum name='survival';
keylegend 'survival' / down=3 location=inside position=topright;
xaxistable atrisk / x=tatrisk class=stratum title="n rsk" location=outside position=bottom
colorgroup=stratum
;
xaxis values=(0 to 2500 by 500 2700);
yaxis values=(0 to 1 by .1) offsetmin=0.1 min=0;
run;
title;
Sanjay, I am wondering if the TatRisk column of data is from Proc Lifetest, and if yes,
how it is specified in Lifetest? SAS 9.4.
Sanjay, I also have the same question about your output data, how did you acquire it from LIFETEST? Neither the output table nor the OUTSURV/OUTTEST will save the column TATRISK, how did you get it?
Thanks
Weijia
Pingback: Graph Table with Class - Graphically Speaking
Pingback: Tips and tricks - Transparent margins - Graphically Speaking