All Posts
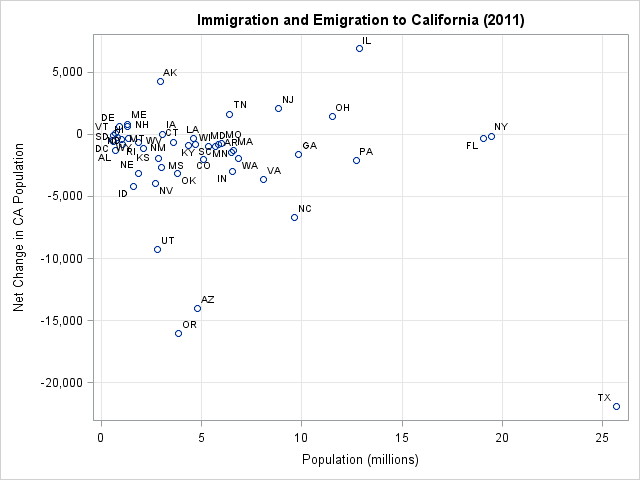

In my four years of blogging, the post that has generated the most comments is "How to handle negative values in log transformations." Many people have written to describe data that contain negative values and to ask for advice about how to log-transform the data. Today I describe a transformation


Young digital natives are learning chess at an unprecedented rate. Three-year-olds learn chess from the tablet and quickly become more knowledgeable than their parents. But unlike most tablet games, chess is a gateway to Science, Technology, Engineering and Mathematics (STEM) education. We grown-ups must optimize the chess-to-STEM pipeline, but how? Consider this


Did you inherit code that was written eons ago? Do you find old programs to copy the PROC REPORT code and then simply change the variable names for your new program? Have you wondered what all of those options do? Do you ever send output to the Listing destination (the
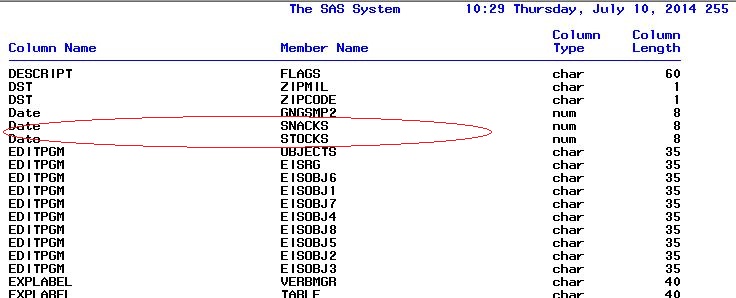

Order must be the most frequent cry for help in the SAS classroom. “HELP,” said my student in the classroom. “I work with messy health data. My users want to see data in this order.” T1.col1, t1.col2, t1.col3, t1.col4, t2.col5, t1.col6 and list the remaining columns in column position from
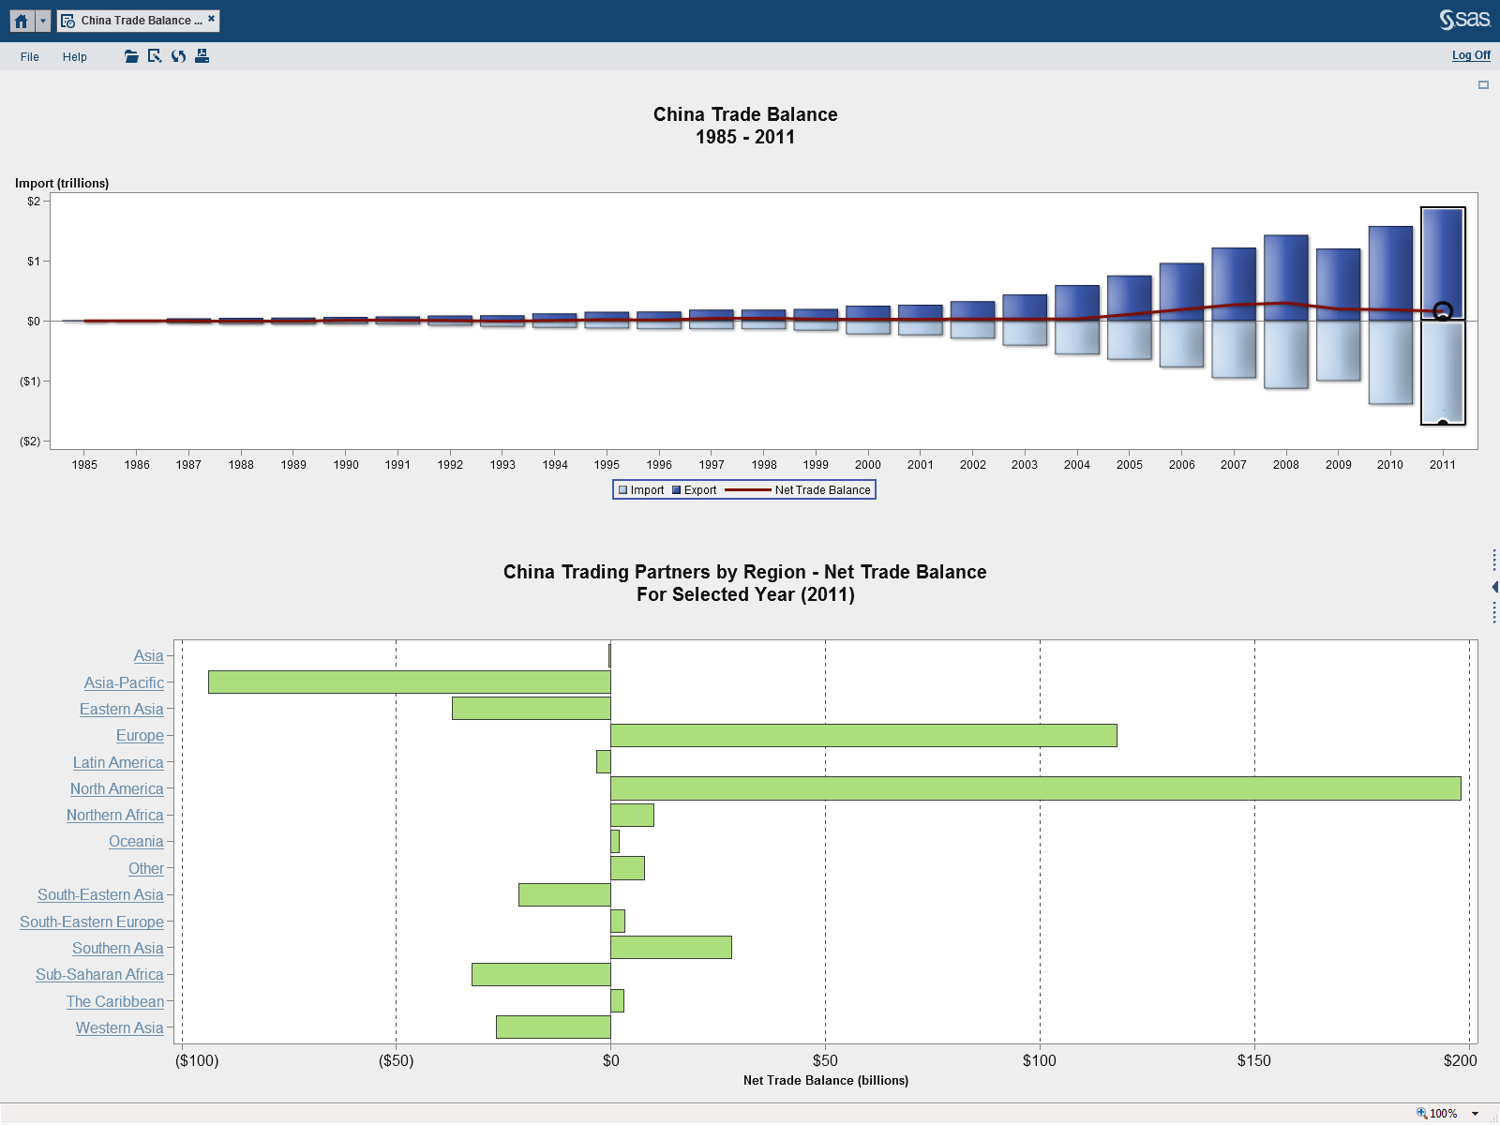

Data visualization tools are a great way to create impactful reports. A well designed report can give users an understanding of their data quickly and easily. And with tools like SAS® Visual Analytics, users can now quickly visualize and understand vast amounts of data. However, with all the visualization options
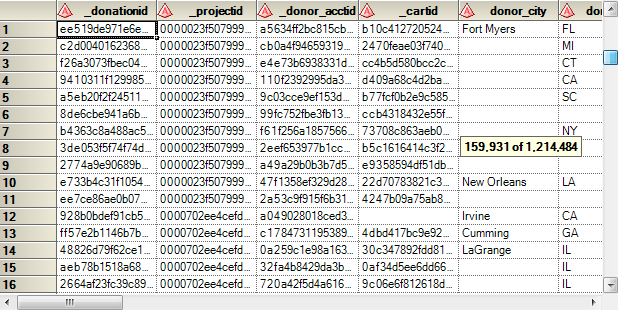

SAS users love to look at data. And the data grid in SAS Enterprise Guide is a convenient way to view the contents of a data set. While small data sets can be rendered lickity-split for quick viewing, sometimes people get justifiably anxious when opening very large data. Perhaps they've


Recently, the American Statistical Association (ASA) released a statement about value-added modeling. This statement was widely covered in the national press, some of which positioned the statement as a significant blow to value-added modeling. However, the ASA statement did not “slam” value-added modeling; rather, the statement’s authors advocated statistical rigor,


Business Intelligence (BI) can mean many things to many people, but generally BI is associated with business reports. When you fold business analytics (BA), especially advanced analytics that are predictive or prescriptive, under the BI umbrella you inherently dilute the value proposition that analytics can provide to an organization. Why
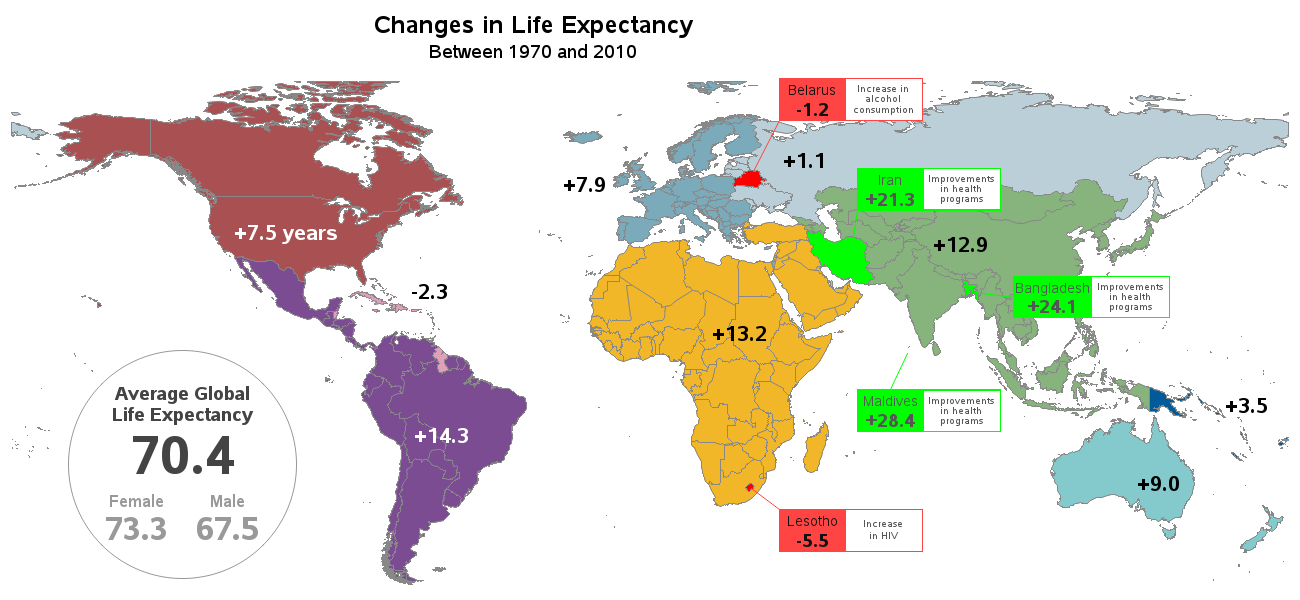

I bet a lot of SAS users know where the phrase "Live Long and Prosper" comes from ... but can we use SAS software to also help analyze 'how long'? This blog posting shows several different kinds of SAS graphs that can help answer such a question! Let's start with


When new SAS users get introduced to the SAS Business Intelligence software (SAS BI), along with the thrill of a wide spectrum of new and desirable functionality, almost always comes a state of confusion – if not panic. How do we go about adapting it to our organization IT guidelines?


Did you know that almost 70 percent of Americans take at least one prescription medication? More than half take at least two, according to a new study by researchers at the Mayo Clinic. And according to the CDC, the average American is on six different medications by the age of

Spirals are cool. And useful. We use them every day without thinking about it. Every time the road turns from a straight line to a curve, we go through a transition spiral. Spirals allow us to change curvature in a steady increasing or decreasing fashion. Without a spiral, this


The word “analytics” is widely misused and misunderstood. While SAS arguably invented the advanced analytics and predictive analytics categories more than 38 years ago, other software vendors have used the term to describe things like reporting, monitoring, and tracking what happened. The value of these more simple capabilities are easily
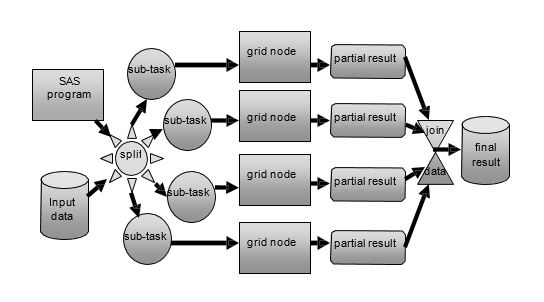

This blog is a continuation of an earlier blog entitled “To grid or not to grid?” In that blog, one of the reasons to say “yes to SAS Grid” is to see if you can gain some performance improvements from modifying your existing SAS processes by converting them to a


Welcome. I'm so glad you're here! This topic will feature tips, stories, and fun to help you on your path to wellness. Look for posts on the first and third Wednesday of each month. What is "wellness"? Wellness is defined by the The American Heritage Stedman's Medical Dictionary as the condition