All Posts


Unless you diligently read the "What's New" chapter for each release of SAS software, it is easy to miss new features that appear in the language. People who have been writing SAS/IML programs for decades are sometimes surprised when I tell them about a useful new function or programming feature.


Perhaps you're a big data expert who is fluent in Pig, Hive, MapR and all the technologies associated with the open source big data framework. Or maybe your role hasn't yet been touched by the increasingly popular Hadoop system. It's certainly worth a few minutes of your time (or perhaps


David Loshin defines reference data and sets up a working definition for his next set of posts.


Sun, surf and SAS await you at this year’s South East SAS Users Group (SESUG) conference. Located at the beautiful Myrtle Beach, South Carolina from October 19-21, the conference offers two full days of learning, networking and problem-solving. “Every year I’ve attended, I’ve found something that I could immediately use
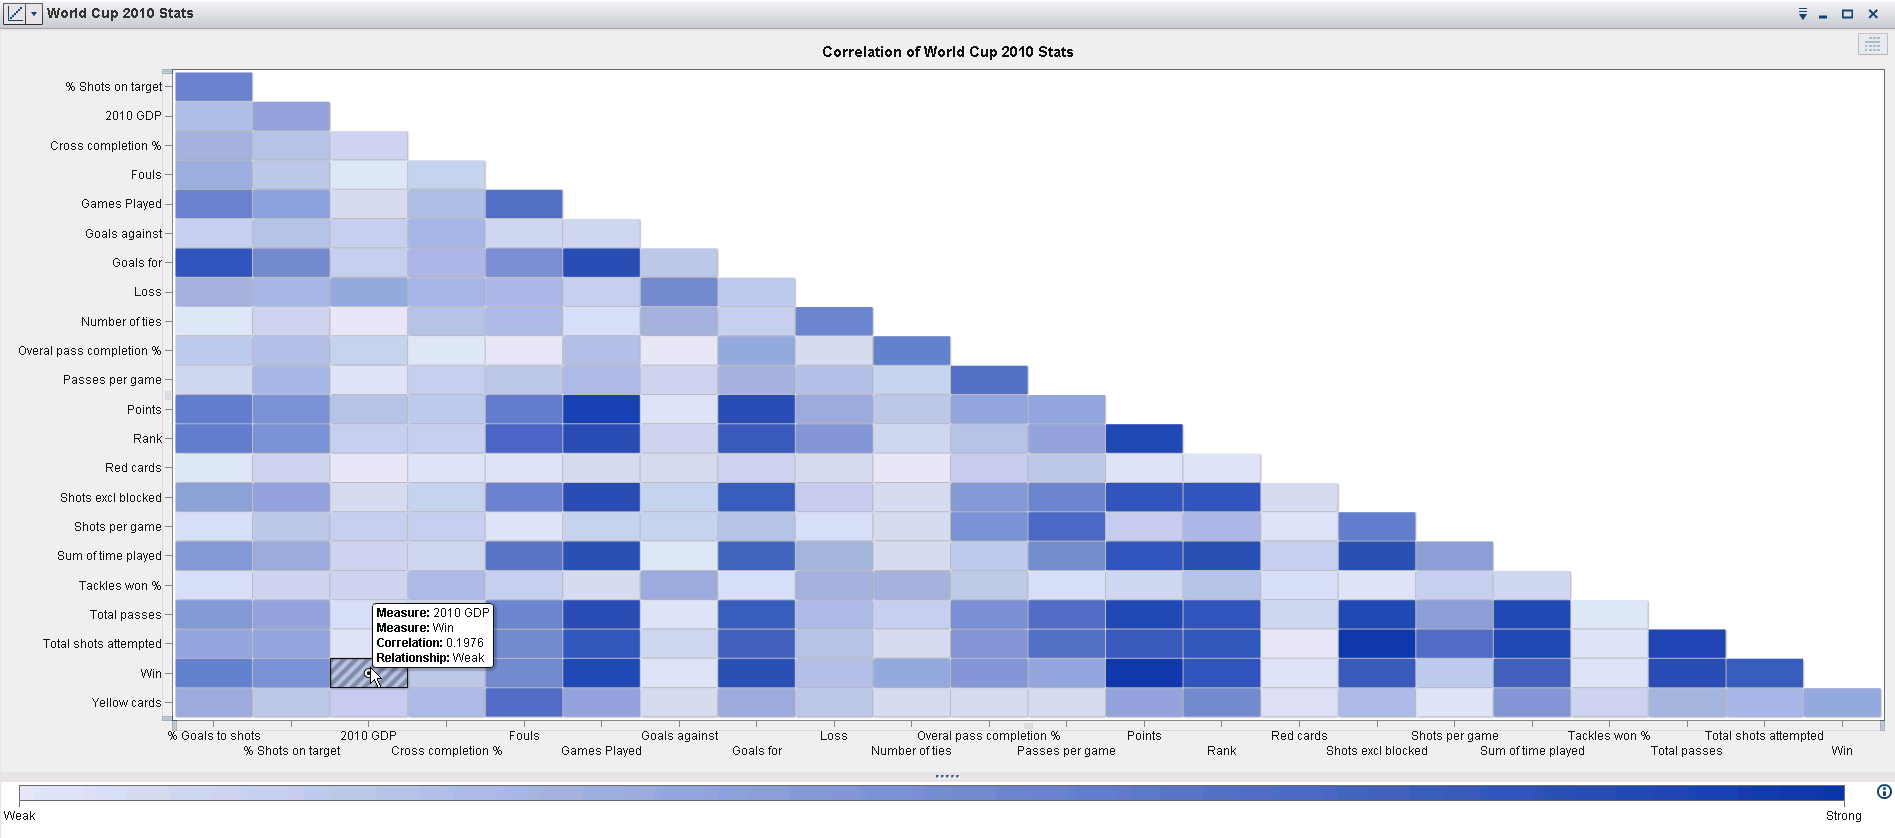

We’re not sure about you, but we just had the most thrilling, suspenseful, and fun month we’ve had in a while. The 2014 FIFA World Cup may be over, but we’re still amazed by not only the game outcomes and level of athleticism, but also by the wealth of interesting
In a previous blog post, I described how to generate combinations in SAS by using the ALLCOMB function in SAS/IML software. The ALLCOMB function in Base SAS is the equivalent function for DATA step programmers. Recall that a combination is a unique arrangement of k elements chosen from a set

A couple of days back, Rick Wicklin forwarded me a link to an article on the BadHessian Blog on creating a Bar Chart using six different freeware packages in R, Python and Julia. The target bar chart was one produced by the Jetpack stat module with WordPress. The graph is shown below. The unique feature of


SAS In-Memory Statistics for Hadoop is a single interactive programming environment for analytics on Hadoop that integrates analytical data preparation, exploration, modeling and deployment. It’s principle components are the IMSTAT procedure (PROC IMSTAT) and the SAS LASR Analytic Engine (or SASIOLA engine for input-output with LASR). Within the SAS In-Memory Statistics


How you flavor your foods can have huge impact on your health. Many of the spices we use to enhance our foods have powerful medicinal benefits like turmeric and ginger. Cinnamon also has amazing benefits and a lot of research behind it.
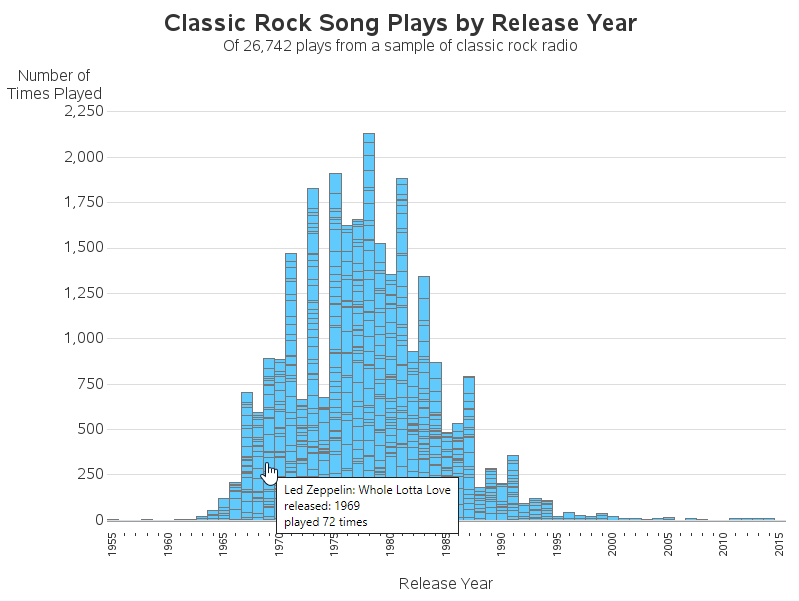

In this blog post, I put some classic rock song data under the SAS Analytics microscope, to see if I could get a better picture of exactly what is considered 'classic rock' these days... Michael Raithel recently pointed me to an interesting article/study about 'classic rock' music, and invited (or is
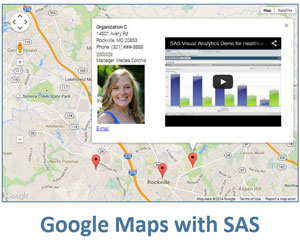

➤ DISCLOSURE! In June 2018 Google introduced changes to the way it handles its Maps platform. They now require API key in order to embed a map, plus Google Maps "projects" must now be associated with a billing account. Unless these new Google rules are met, Google maps described in


Do you know something about SAS® software that other SAS users would love to learn? Of course you do! Whether you’re a student or a member of the Circle of Excellence, every SAS programming project, every analysis or forecasting model is an opportunity to gain new insights into SAS processing

IT folks love SQL (Standard Query Language). Once you know how to program in SQL, you can work with almost any database because it is a standard. However, SQL is NOT a standard for doing analytics. The SAS programming language pre-dates SQL and even though SAS does SQL, SQL does not
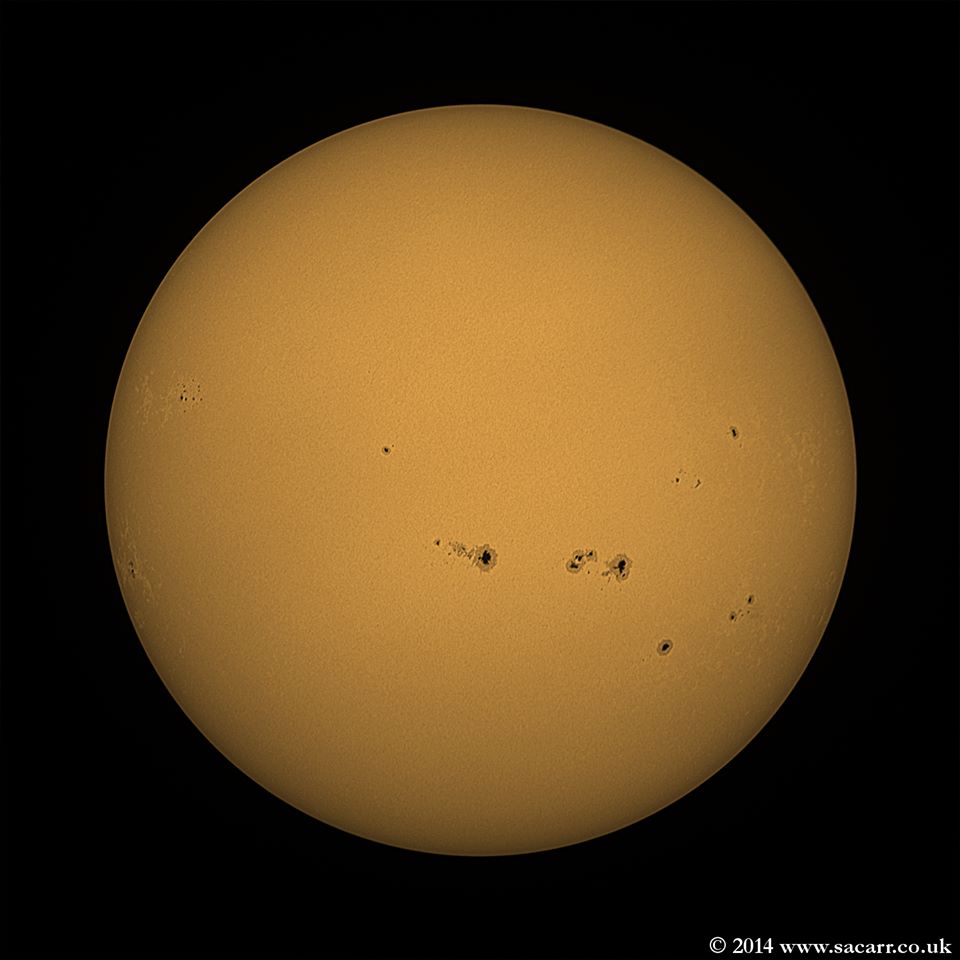
The sun has gone eerily quiet, in the middle of what should be the height of the 11-year sunspot cycle... Here's a superb photo of some sunspots that Stephen A. Carr posted to the Telescope Addicts Facebook group - a group which I follow with great interest. (Thanks for allowing

I had the privilege of attending the inaugural Women in Hollywood IT Society (WHITS) meeting this past week in LA. The meeting was hosted by the Media and Entertainment Services Alliance (MESA) with lots of organization from two female IT executives from Sony Pictures. Sony Pictures already has a Women