All Posts


By now, we have all heard about the Internet of Things (IoT), or the Industrial Internet. Across industries, organizations are attempting to instrument and measure all critical business systems and assets in an effort to drive improved production and service delivery. It is estimated that by 2020, companies will spend
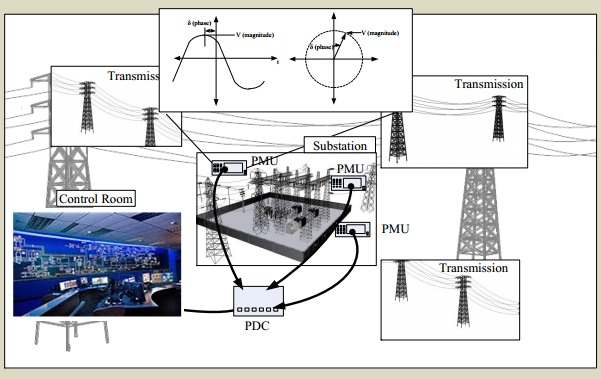

You’ve heard about the smart grid, but what is it that makes the grid smart? I’ve been working on a project with Duke Energy and NC State University doing time-series analysis on data from Phasor Measurement Units (PMUs) that illustrates the intelligence in the grid as well as an interesting

In my last post, I pointed out that we data quality practitioners want to apply data quality assertions to data instances to validate data in process, but the dynamic nature of data must be contrasted with our assumptions about how quality measures are applied to static records. In practice, the

Back in the day when the prison system forced inmates to perform "hard labor", folks would say (of someone in prison): "He's busy making little ones out of big ones." This evokes the cliché image of inmates who are chained together, forced to swing a chisel to break large rocks

In the SAS DATA step, all variables are scalar quantities. Consequently, an IF-THEN/ELSE statement that evaluates a logical expression is unambiguous. For example, the following DATA step statements print "c=5 is TRUE" to the log if the variable c is equal to 5: if c=5 then put "c=5 is TRUE";

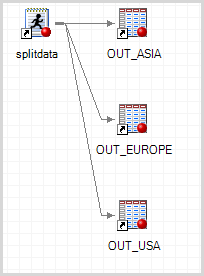
Everyone is always looking for test data. Business analysts want it for demos and prototypes. Software developers want it for development and unit testing. Testers want it for system and integration testing. I’ve written many programs to generate test data over the years, as have many other SAS users. Generated

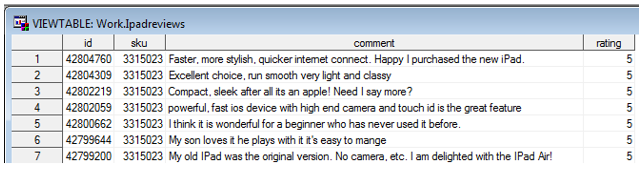
Utilizing big data analytics is currently one of the most promising strategies for businesses to gain competitive advantage and ensure future growth. But as we saw with “small data analytics,” the success of “big data analytics” relies heavily on the quality of its source data. In fact, when combining “small” and “big” data


Have you ever wondered whether the area where you live is a good location for producing solar power? Let's create a SAS map to help find out! To get you in the right frame of mind, here is an awesome picture of some Arizona sunshine, that my good friend Eva
At the beginning of my book Statistical Programming with SAS/IML Software I give the following programming tip (p. 25): Do not confuse an empty matrix with a matrix that contains missing values or with a zero matrix. An empty matrix has no rows and no columns. A matrix that contains


In my previous post, I talked about how the Internet of Things promises new ways to use sensor and machine data by creating a highly efficient world that demands constant analysis and evaluation of the state of events across everything that surrounds us. I have also explained why it is


New Year to me is always a stark reminder of the inexorability of Time. In a day-to-day life, time is measured in small denominations - minutes, hours, days… But come New Year, and this inescapable creature – Time – makes its decisive leap – and in a single instant, we


According to analyst firms, consulting companies and various other research, customer experience is the primary priority for insurance companies. But is customer experience overrated? Let’s start by considering the primary interactions between an insurance company and its customers: new business, billing, renewals and claims. Ask any insurance executive, especially property


Esta es la experiencia de Felix Liao, Gerente de Soluciones de Data Management de SAS para Australia y Nueva Zelanda. Nuestro personaje hizo un viaje hace poco por toda Australia visitando algunos clientes para conversar con ellos sobre las tendencias de Analítica y Hadoop. Además de quedar gratamente sorprendido con

@philsimon on the need to recognize DQ differences.
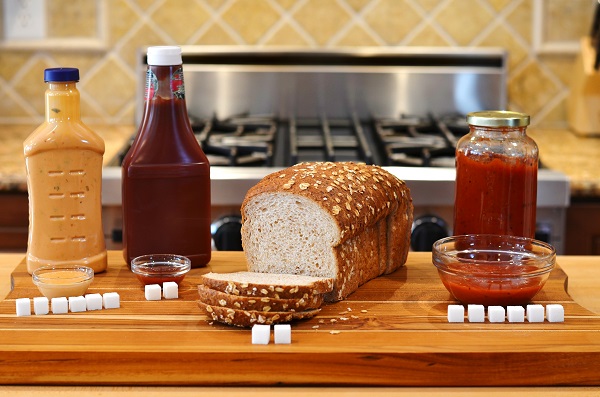

By now most of us are at least aware of the fact that too much sugar isn’t good for us. But you may not be aware of some of the hidden sources of sugar like "not so sweet" foods such as pasta sauce, salad dressing, ketchup and bread. Some other