All Posts


As the point person for SAS joining the new Open Data Platform (ODP) initiative, I want to make it clear why SAS is involved with ODP, and why we think it’s important to our customers, and the Hadoop and big data ecosystem as a whole. SAS is not in it to

Hadoop is increasingly being adopted as the go-to platform for large-scale data analytics. However, it is still not necessarily clear that Hadoop is always the optimal choice for traditional data warehousing for reporting and analysis, especially in its “out of the box” configuration. That is because Hadoop itself is not


How many of us have heard or even said the phrase, "If it's not broke, don't fix it." While on rare occasions this may be the correct approach, it is a statement that stops innovation and creativity in its tracks. You might as well say, "Because we've always done it that


Another Valentine's Day has passed. I often wonder where the time goes. It seems like yesterday my daughter was buying those little cards and sharing cut out hearts with her peers. Now, she's 15 and this year she had fun in a different way and I was happy to be


La analítica de negocios se ha convertido en la solución ideal para empresas de los diversos sectores económicos, sin embargo, ha llegado el momento de que los países se apropien y lleven a cabo nuevos planes de profundización, especialización y educación en este campo. Ya no basta con saber que
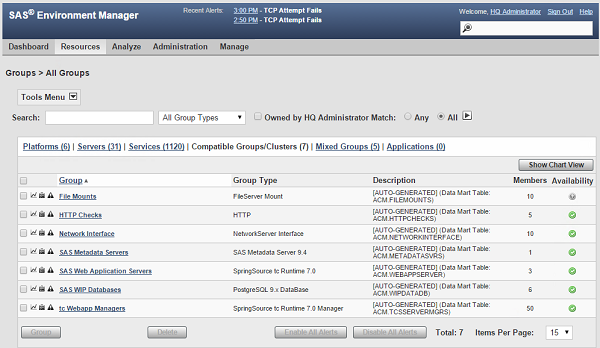

Many larger SAS deployments have multiple instances of similar SAS-related servers. For example, a distributed SAS Enterprise BI environment may have several machines running instances of the object spawner or the OLAP server. Similarly, all of your distributed SAS Visual Analytics deployments have worker nodes that are typically dedicated Linux
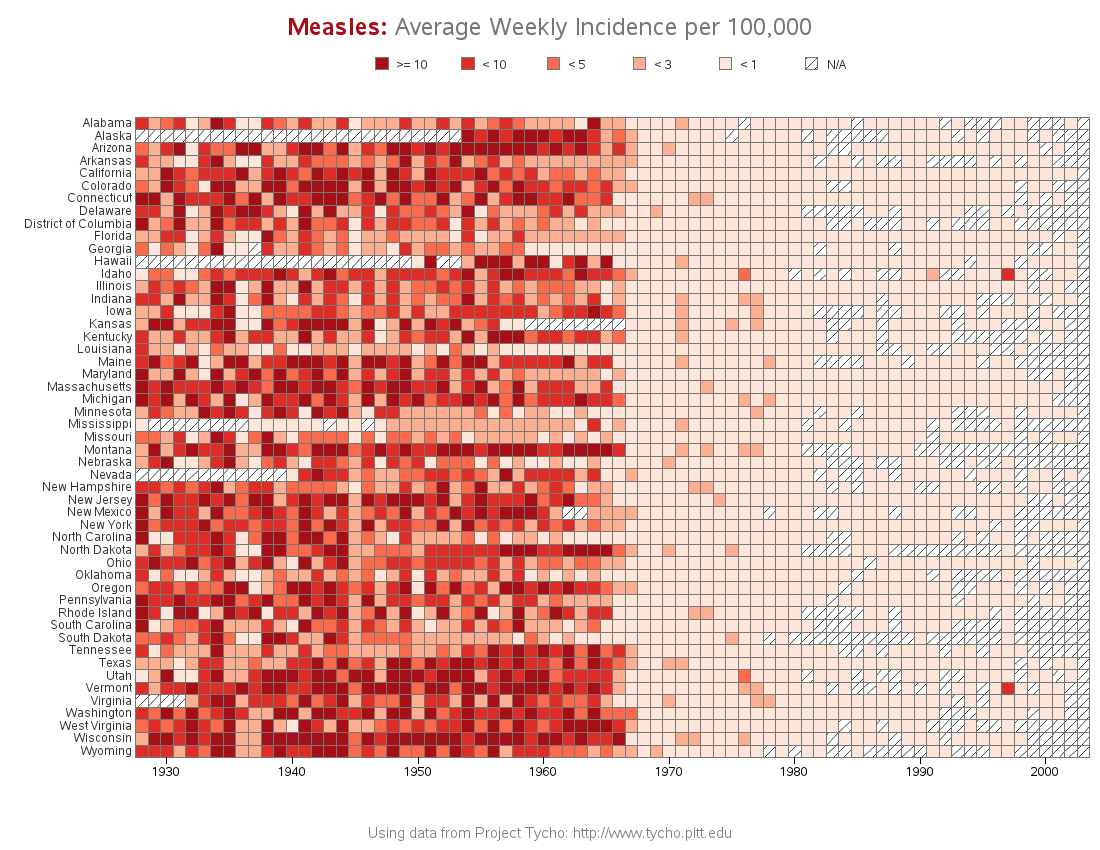

The Wall Street Journal recently published some graphs about seven infectious diseases, and I tried using SAS to improve the graphs ... it's a veritable infectious disease (graph) bake-off! Let's start with Measles ... here's a screen-capture of WSJ's measles graph: In general, their graph is eye-catching, and I learned a lot

When asked what his movement wanted around a century ago, the iconic American labor leader Samuel Gompers famously gave a one-word answer: "More." This annoyed his opponents at the negotiating table and many in the business community. He was not demanding a specific wage increase or fighting for a distinct cause like


To develop a custom task for use in SAS Enterprise Guide (or SAS Add-In for Microsoft Office), you need a few things: A working knowledge of SAS and SAS Enterprise Guide Microsoft Visual Studio (the free Express edition will do, though the Professional edition is better) Some experience with C#
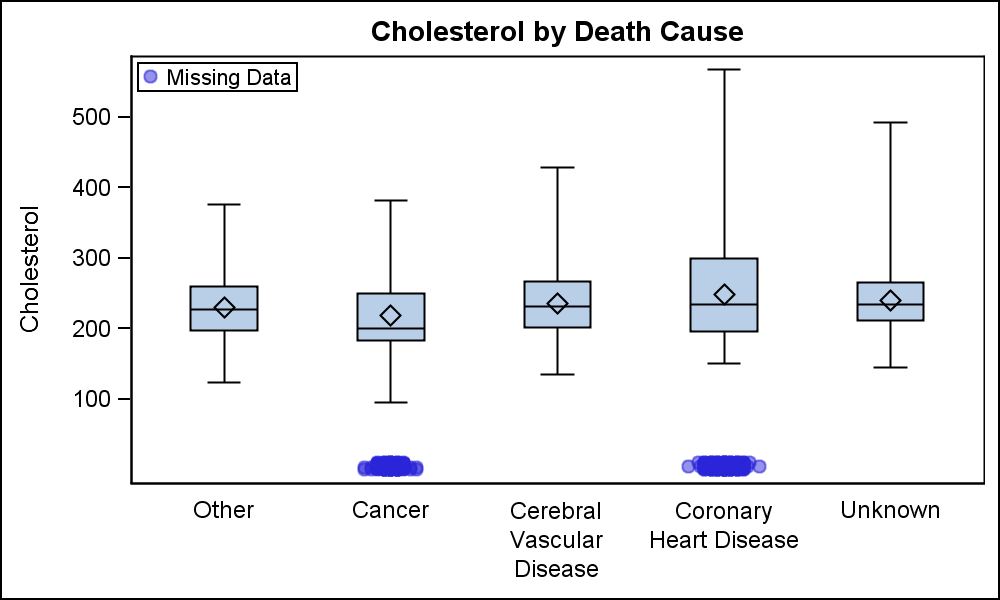

Last week a user wanted to view the distribution of data using a Box Plot. The issue was the presence of a lot of "bad" data. I got to thinking of ways such data can be visualized. I also discussed the matter with our resident expert Rick Wicklin who pointed

If you are looking for a way to fund your data quality objectives, consider looking in the closets of the organization. For example, look for issues that cost the company money that could have been avoided by better availability of data, better quality of the data or reliability of the


Data Management has been the foundational building block supporting major business analytics initiatives from day one. Not only is it highly relevant, it is absolutely critical to the success of all business analytics projects. Emerging big data platforms such as Hadoop and in-memory databases are disrupting traditional data architecture in


For hotel companies, it is challenging to find new ways to differentiate in an ever evolving marketplace. There is a lot of talk in our industry about the increasing numbers of third party channels and distributors to have entered the marketplace, and how that impacts the hotel company’s core business.


Have you ever created a SAS macro variable and at resolution time received a warning that it did not exist? Many times this warning is because your program referenced the macro variable outside the scope it was created in. Every macro variable created is stored in one of two symbol


Cupid is bearing down on me again, and I’m still only thinking about what gifts to give my wife and daughter for Valentine’s Day. At this point, I’m hoping for divine inspiration. Based on holiday shopping research we conducted in November, I’ve learned that the gifts women expect to receive