All Posts


With so much information available about high-performance analytics, business intelligence and visual analytics, it can be difficult to know exactly where to begin, especially if you don’t have a team of statisticians standing by. I'm frequently asked by customers who hope to take advantage of analytics how to get started. How do
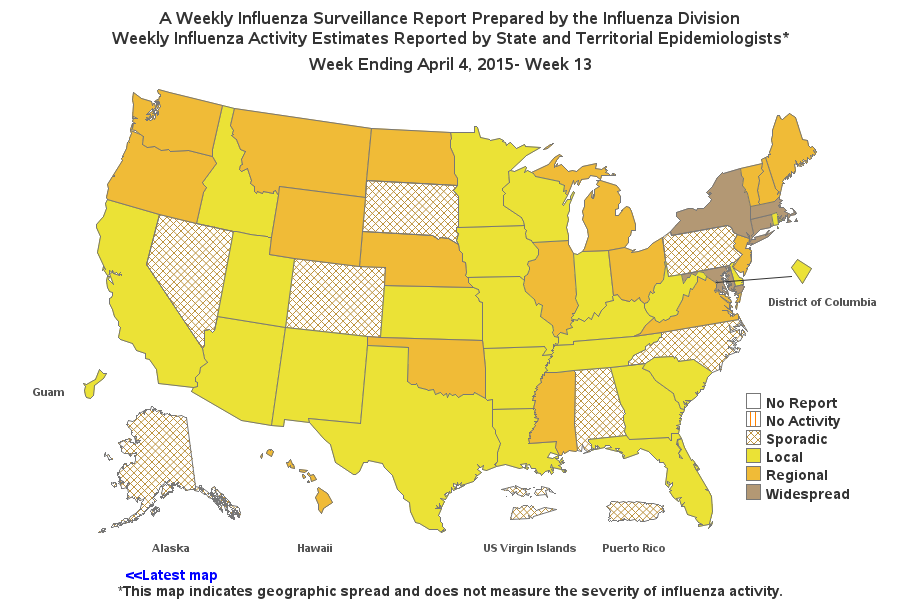

Has this year's flu been better or worse than you thought it would be? There are a lot of factors that help determine whether or not you're likely to get the flu. Is there a bad strain going around? Did the flu vaccine target the right strain? Did you get


If you are one of the thousands of SAS users soon to be in Dallas for SAS Global Forum, you've probably already used the online tools to help you view sessions related to your industry. It’s easy to do by filtering on your own particular industry, such as banking, or

In the last few days, I have heard the term “data lake” bandied about in various client conversations. As with all buzz-term simplifications, the concept of a “data lake” seems appealing, particularly when it is implied to mean “a framework enabling general data accessibility for enterprise information assets.” And of


Unplugging for a week: Crazy or possible?! How many of you have had that day, weekend or week when you ask yourself “what else can the kids do?” Not only for their sanity but for yours too! We all want the same things for our kids: to stay as active as


Estamos ante la era del Big Data y las modernas soluciones que existen actualmente en el mercado hacen cada vez más fácil manejar los grandes volúmenes de información. Sin embargo, vale la pena preguntarnos, ¿son necesarios tantos datos? En otras palabras, si su solución de analítica puede organizarlos, consolidarlos y

I press a button, a miracle machine churns through all the calculations in the world and the answer to the Ultimate Question of Life, the Universe, and Everything[1] is produced as a single number. Oh hang on, that’s 42. Alright, for our microcosm, let’s stick to the answer to my


After working as a flight attendant for more than 20 years, Lauren Guevara was ready for a new adventure. The inspiration for her journey came from an article she read in CNN’s Money magazine that highlighted the earning potential of a SAS Certification. Also having earned a Master of Science


This is a follow up to last week’s blog on understanding your customers’ perceptions of quality. As the world’s largest manufacturer of PCs and tablets, Lenovo is always looking for areas to reduce costs while increasing quality and customer satisfaction. Six months ago, Lenovo implemented the Lenovo Early Detection (LED) system

How simple is too simple, when it comes to analyzing data on a map? The KISS principle can be applied to many things, including graphs and maps. What is the KISS principle, you might ask? Well, it's not the rock band that my friend Patricia (pictured below) has been known


Contributed by Kim Truong, Sr. Marketing Manager, Hortonworks, where she is responsible for partner marketing with SAS. At Hortonworks, we’ve been working with SAS engineering teams since 2013, allowing our customers to leverage the inherent scale-out compute and storage capabilities of Hadoop in combination with the richness of SAS analytics.
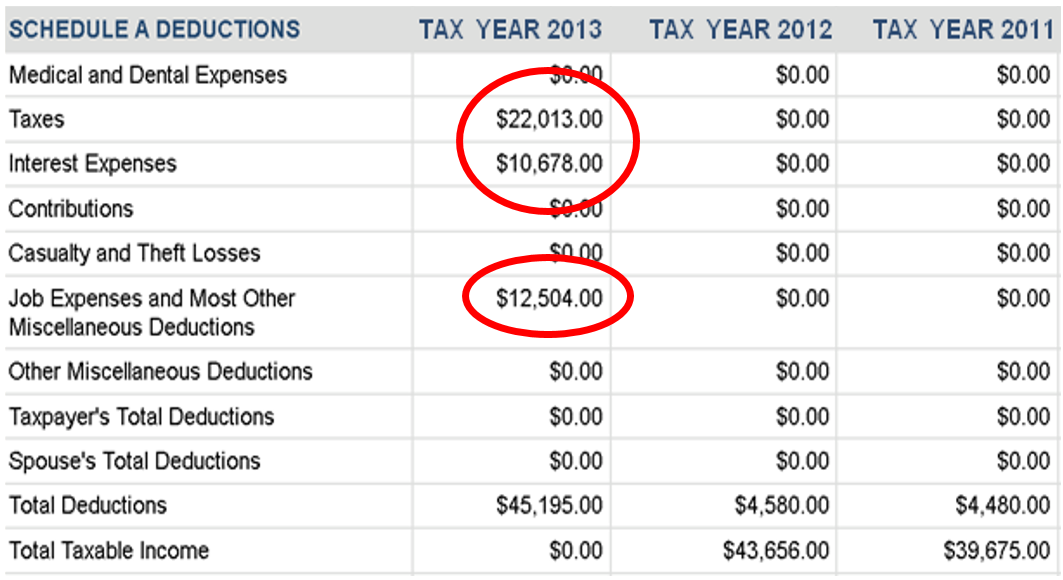

Tax fraud…5-7 years in prison. I thought I had it all figured out. The government wades through millions of returns and tries to issue refunds quickly. Sure, I filed over a thousand for my clients, but that’s just a blip on their radar. I never thought I’d get caught. But
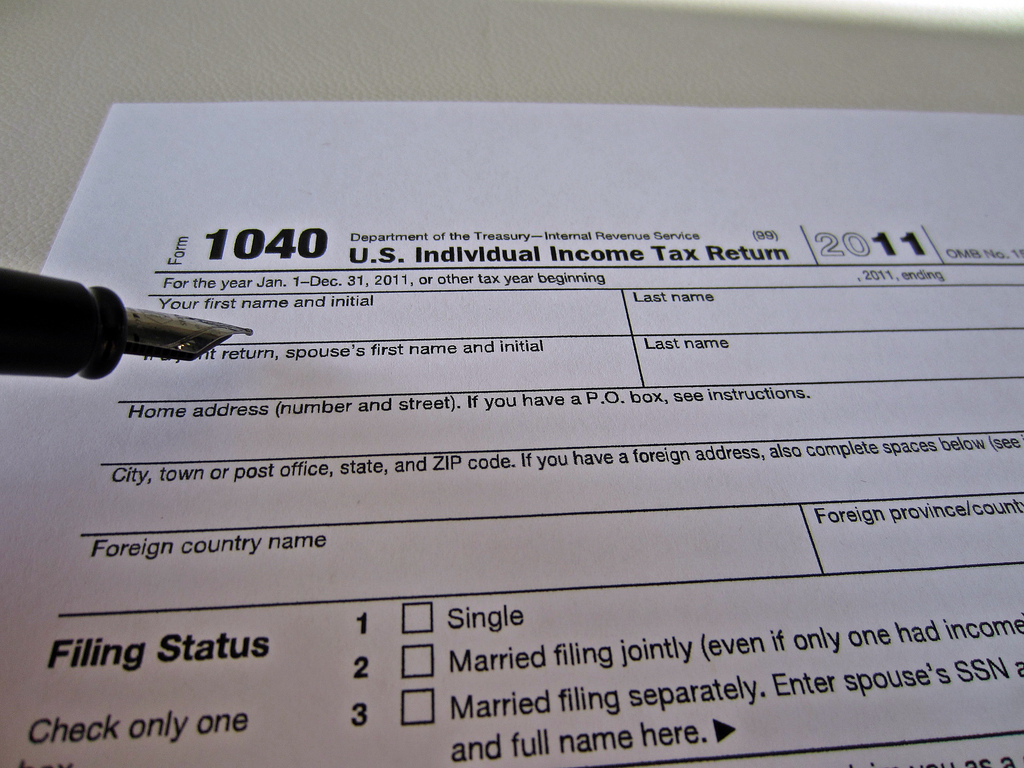

Judging by the spike in media coverage of tax fraud, one might think accountants have suddenly been inspired by Breaking Bad re-runs, and turned en masse to lives of crime. Umm… no. But, there are two good reasons for all the attention. One reason is because of a new law
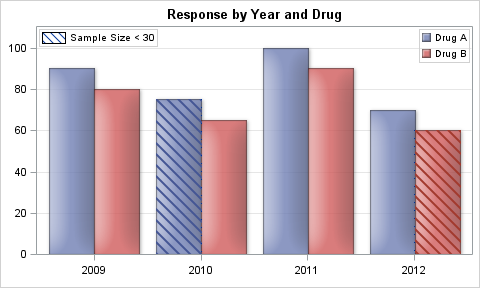

Back in late 2012 I discussed a technique for Conditional Highlighting, where additional attributes can be displayed in a graph. In the previous article the goal was to display a graph of Response by Year by Drug. We used a cluster grouped bar chart to create the bar chart. We

I took another trip to California and, of course, allowed Ed to come with me. San Francisco is an amazing place to visit (especially in March when it’s cold and wet in North Carolina.) On this trip, we met with wonderful group of people, the California Transcribers and Educators for