All Posts


For Parent’s Weekend this year, I needed to choose a restaurant for dinner in my son’s college town. Our extended family was attending the college football game and spending the weekend with our son. Before making my decision, I searched the internet for all the restaurants located within a reasonable


You may be intrigued to know how the average person compares to a gold medal winning Olympic athlete when it comes to things like height, body mass, resting heart rate, arm span, body fat etc. Or, perhaps more frightening, how you measure up? I know this will resonate with my


Public educators have increasingly been told to produce the “workforce of the future.” States are striving for alignment between what students learn and the jobs that ultimately will be available to them. This alignment is critical for students so they have the right skills and knowledge to excel at college
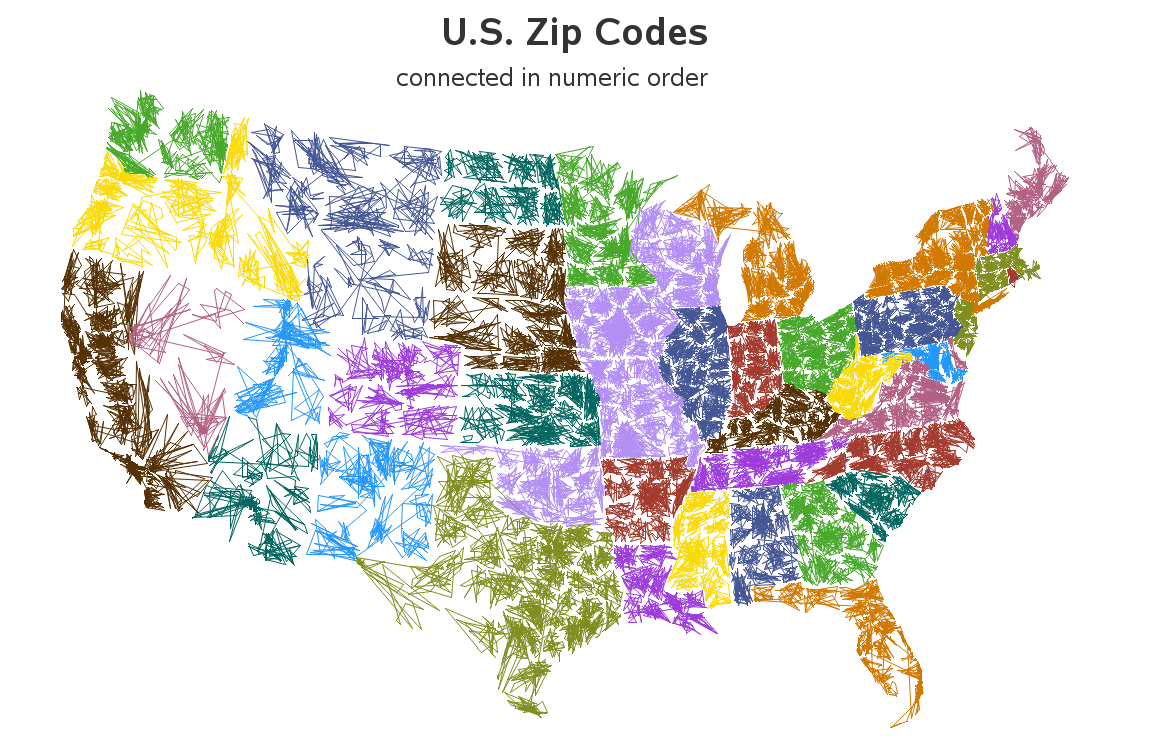

When I saw Robert Kosoro's cool ZIPScribble map, I knew I had to create a SAS version - and of course I had to add a few enhancements along the way.... I was perusing some of the examples on dadaviz.com, and Kosoro's ZIPScribble map caught my attention. It wasn't a particularly useful

One of the common traps I see data quality analysts falling into is measuring data quality in a uniform way across the entire data landscape. For example, you may have a transactional dataset that has hundreds of records with missing values or badly entered formats. In contrast, you may have

You might be surprised at how many movies and TV shows are made in North Carolina - especially within the last few years. This blog provides a SAS graph that will make the list of films even easier to read! A recent story by the Tar Heel Traveler, and an exhibit


Seguramente ya ha escuchado hablar sobre Hadoop y todas sus potentes capacidades, de no ser así, este sistema no es más que un marco para software de código abierto que permite almacenar y procesar grandes volúmenes de datos de forma distribuida en un gran número de productos de hardware. En

In The Princess Bride, one of my favorite movies, our hero Westley – in an attempt to save his love, Buttercup – has to navigate the Fire Swamp. There, Westley and Buttercup encounter fire spouts, quicksand and the dreaded rodents of unusual size (RUS's). Each time he has a response to the

Somebody once said that relationships are not easy. Well now they are—in SAS 9.4, at least! SAS objects have inherent relationships and dependencies, and a change to one element can often have an impact on one or many related objects. For example, for SAS Visual Analytics reports to work as


As a personal trainer, one of the top comments I hear from clients is that they want to “tone up.” Some even go as far to tell me which area of their body needs said toning. What they’re really saying is that they want more muscle and for that


Warranties have a long - and some might say - interesting past. But the future is even brighter. New technologies and data sources are transforming our understanding of field quality, enabling deeper insights into product performance and customer preferences. These breakthroughs are accelerating the quest to reduce defects and satisfy customers.

Many of us have schedules packed so tight we don’t have room to eat a meal sitting down much less read a novel or go for a long walk. With work, family, friends and other commitments, our days, weeks and months speed by us. It is easy to get caught

In my last post, I pointed out that an uninformed approach to running queries on top of data stored in Hadoop HDFS may lead to unexpected performance degradation for reporting and analysis. The key issue had to do with JOINs in which all the records in one data set needed

Financial institutions are mired with large pools of historic data across multiple line of businesses and systems. However, much of the recent data is being produced externally and is isolated from the decision making and operational banking processes. The limitations of existing banking systems combined with inward-looking and confined data practices


This year I am expecting SAS Global Forum to be one of the biggest and best ever! The SAS Global Users Group makes changes and enhancements each year at SAS Global Forum based on the feedback we receive from SAS users. And I am pleased to be the first to