All Posts

When I ask people what they know about Denmark they often mention Hans Christian Andersen. He was born in Denmark in 1805 and is one of the most adored children’s authors of all time. Many of his fairy tales are known worldwide as they have been translated into more than


Will the Internet of Things (IoT) create a web of connected devices that make our lives better or an infinite infestation of annoying devices invading our privacy for no good reason? I don't know. I do know that the answer is going to depend less on the technology and more


The school year has begun, and, as parents, we are intensely curious about what is going on in the minds, hearts, and lives of our children during those hours they are away from us. We try to act nonchalant as we query, "How was your day?", but we are anything


This post is the third and final in a series that illustrates three different solutions to "flattening" hierarchical data. Don't forget to catch up with Part 1 and Part 2. Solution 2, from my previous post, created one observation per header record, with detail data in a wide format, like

With all of the classes and presentations offered at this year’s Western Users of SAS Software conference, planning your activities can easily become overwhelming. Have no fear – we are here to help! Below are five “can’t miss” happenings at WUSS 2015! 1. Jennifer Waller’s Keynote Address - Wednesday, September 9

There is a time and a place for everything, but the time and place for data quality (DQ) in data integration (DI) efforts always seems like a thing everyone’s not quite sure about. I have previously blogged about the dangers of waiting until the middle of DI to consider, or become forced


In a little more than two weeks, I will be in one of my favorite places, San Diego, California, recruiting potential SAS Press authors at the JMP Discovery Summit, which will be held at the beautiful Paradise Point Resort and Spa from 14 September to 17 September 2015. I’m especially
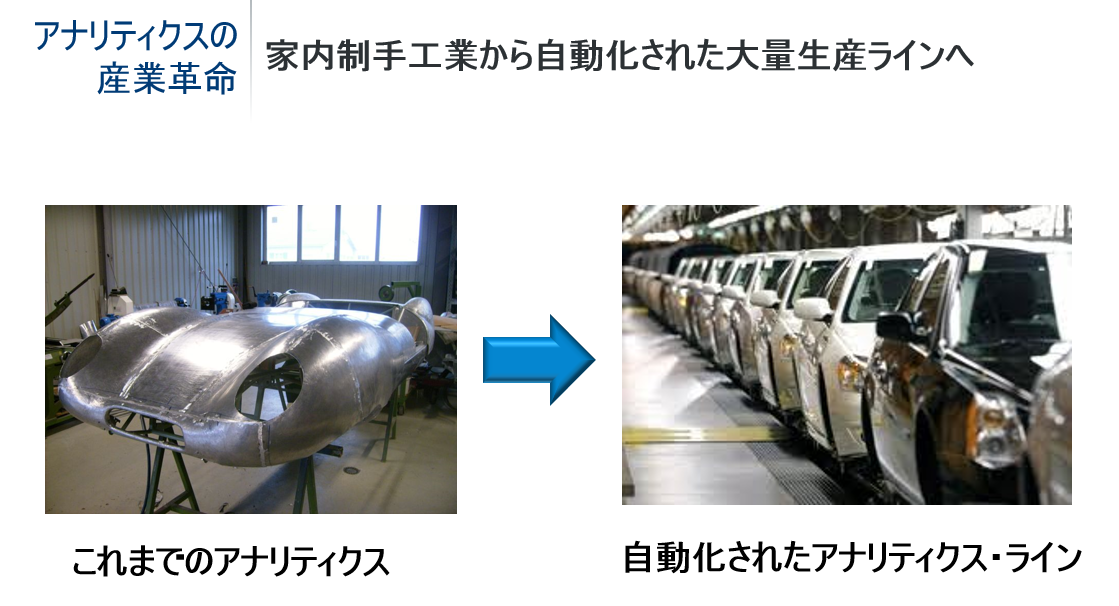

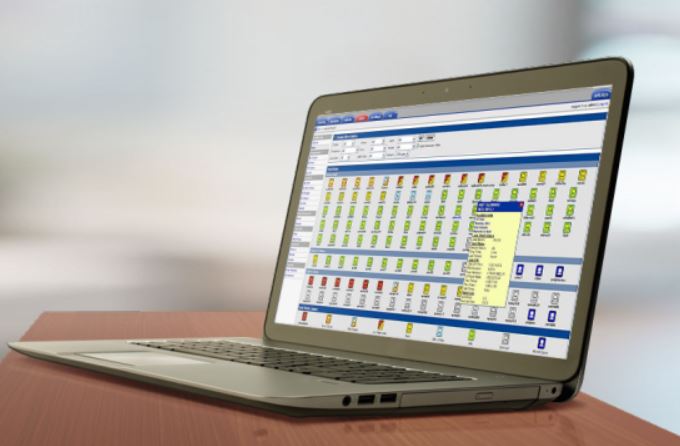
15年前 2000年、当時すでに(今では機械学習に分類されるいくつかのアルゴリズムを搭載した)予測モデリングツールSAS® Enterprise Minerはこの世に存在していました。また、予測モデリングにおけるSASの方法論であるSEMMAプロセスも同時に存在していました。SEMMAプロセスとはSASがそれまでに培ったベストプラクティスであり、Sample(当時は1%サンプリングで十分だと立証する論文がいくつもありました)、Explore(探索、分布の確認)、Modify(補完、置き換え、変換、連続量のカテゴリカル化など、予測モデルの精度を上げるための工夫。昨今Deep Learningでは逆にこれらをせずにありのままがいいという考え方もあります)、Model(決定木などのモデル手法の適用)、Assess(複数の予測モデルから予測パフォーマンスの良いものを選択)であり、これらを順に実施することで誰でもそれなりに精度の高い予測モデルが作れました。この方法論と方法論にのっとったEnterprise Minerのおかげで、初めての分析プロジェクトにおいて何の迷いもなく顧客の解約を予測する予測モデルを作成でき、一瞬のうちに自分が「できる分析者」になったかのように感じたのを覚えています。 学生時代、実験結果の分析にSASをプログラミングで使用していた筆者にとっては、アイコンを並べて線を繋ぐだけでよいこのツールが魔法のように感じていました。しかし同時に「アイコンの並べ方、設定、当てはまりのいい手法にはパターンがあるなあ」と感じていましたし、加えて「マウスのドラッグ&ドロップという操作がちょっと面倒」だとも感じていました。 その頃、あるお客様は、サンプリングではなく全件分析で得られる価値に重きを置き、数日にわたる予測モデリング処理を実行していました。当時の世界で最大級のUNIXを使用したチャレンジは、もちろん技術的な制約により処理を完結することそのもが一つの課題でもありました。まさに「ビッグデータ」を筆者が最初に体験した場でした。 2015年 15年前、少ないコンピューターリソースしか持たない我々は、いかに顧客をあまり多くない、説明しやすいグループに分けるかを考えていました。『顧客の顔の見える化』と当時の多くのプロジェクトでは呼んでいました。しかし、今日では消費者の嗜好が多様化し、サービスや商品も多様化かつ大量化し、サービスや商品の寿命が短くなり、販売チャネルも多様化しました。予測モデルを使用して、単に顧客を理解するだけではなく、収益を最大化するためには、そのような多様性を失わない大量のセグメントごとに予測モデルを作る必要がでてきたのです。 このような分析対象の数の増加や粒度の増加、さらには分析対象データ量の増大は、近年、組織の分析チームの責任者にとっては、「予測モデル作成業務の生産性の向上」というミッションとして、大きな課題になってきたのです。 従来、予測モデルの作成は、分析サービスを提供する企業などだけが実施する、一部の人の道具でした。しかし時代は変わりビッグデータブームにも後押しされ、アナリティクスを活用する/したい組織・企業は増加の一途をたどっています。しかし、高度な数学的考え方に基づく予測モデリング手法を高等教育で学んで社会に出る人材はそれほど増加していません。そこに、「アナリティクス人材」の不足問題が生じています。 2015年、ガートナー社は「市民データサイエンティスト」という言葉を新たに定義しました。これまで高度な分析に縁遠かった、統計学や数学の専門知識を持たない業務部門の担当者が必要に迫られて予測モデリングをするようになってきたという状況をうまく表現していると思います。 さらに、この15年で、情報技術の進化と共に、より計算が複雑な手法、すなわち、昨今では機械学習と呼ばれるような高度なアルゴリズム、複数のモデルを組み合わせるアンサンブル手法、など、以前は、コンピューターの処理能力の制約で利用できなかった洗練された大きな計算能力を要する手法が登場してきました。それぞれの手法には特徴や向き不向きがあり、データの性質や予測したい事象の性質に適した手法を使用することで、より良い意思決定が可能となります。SASもこの間、Base SASエンジンから、In-Databaseへ、そしてSAS In-Memory Analyticsへとアルゴリズムの実行環境をシフトしてきています。 この15年間で予測モデル作成プロセスそのものの考え方は変わっていませんが、それを取り巻く環境や期待が大きく変化したことにより、予測分析に対する要件も変化してきています。近年、アナリティクスを武器とする企業が求めている大きな3つのポイントは以下の通りです: 扱いやすさ: 高度な分析・ITスキルを持たないビジネスユーザーでも扱えること スピード: 大量データ、多数のセグメントに対してスケーラブルであること 正確性: 収益を左右するモデルのパフォーマンスが良いこと(精度が高いこと) SAS® Factory Minerリリース SASはこのような要望に応える形で、このたびSAS® Factory Minerという新製品をリリースしました。 ボタンクリック一つで自動的に、 最新の機械学習アルゴリズムを使用して、 これまでに培ったベストプラクティスに基づいた、 最良の予測モデルを作成することが可能となります。 従来、GUIとはいえ、人手でひとつひとつ時間をかけて実施していた予測モデル作成業務の時代から、全自動の-すなわち、モデリングプロセスにおける試行錯誤と手動プロセスを不要とし、データの特性に応じた最適なデータ変換手法と最適な機械学習アルゴリズムを自動で選択肢し、一つの操作でセグメントごとの予測モデルを作成できる-時代がやってきました。 まさに、予測モデリングの世界における産業革命です。 SAS® Factory Minerの紹介ビデオ 60秒で語るSAS Factory Miner
This post is the second in a series that illustrates three different solutions to "flattening" hierarchical data. Solution 1, from my previous post, created one observation per header record, summarizing the detail data with a COUNT variable, like this: Summary Approach: One observation per header record Obs Family Count


La respuesta a esta pregunta transformará los negocios como los conocemos hoy e impulsará a la industria financiera hacia la era digital... Con la cantidad de información que se genera día a día, usted como líder de su empresa ahora tiene dos opciones: La primera es dejar el Big Data

If you have, or are considering, SAS Grid Manager, you’ll be excited to hear about two new changes to the product that make it even better for managing and processing in your analytics environment. The two changes were made in conjunction with the release of SAS 9.4M3 in July, and


As of April 15, 2015, Oracle is no longer providing public updates of the Java 7 runtime environment (JRE) or software development kit (JDK). SAS 9.3 and SAS 9.4, however, continue to rely on Java 7 for support of business production. SAS has therefore contracted with Oracle to continue receiving

While not on the same level of Rush, I do fancy myself a fan of The Who. I'm particularly fond of the band's 1973 epic, Quadrophenia. From the track "5:15": Inside outside, leave me alone Inside outside, nowhere is home Inside outside, where have I been? The inside-outside distinction is rather apropos


The foods we eat play a huge role in how well our body functions, positively or negatively. If you are training for a sports event or competition, you want to make sure your body is functioning at its peak! This could be a 5K, 10K, Triathlon, Spartan Race, or any

A family and its members represent a simple hierarchy. For example, the Jones family has four members: A text file might represent this hierarchy with family records followed by family members' records, like this: The PROC FORMAT step below defines the codes in Column 1: proc format; value $type