All Posts


When you’re making a report, how do you choose which procedure to use? The answer is – it depends. It depends on: whether you are doing an ad hoc analysis or creating a final report that many people will see whether you will run statistical tests with your data or
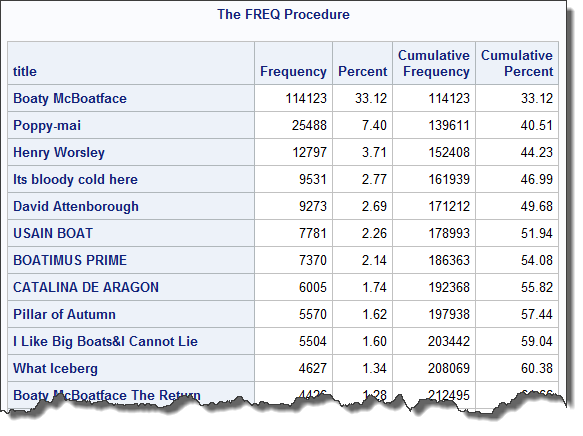

I know what you're thinking: two "Boaty McBoatface" articles within two weeks? And we're past April Fool's Day? But since I posted my original analysis about the "Name our ship" phenomenon that's happening in the UK right now, a new contender has appeared: Poppy-Mai. The cause of Poppy-Mai, a critically


As I explained in Part 1 of this series, spelling my name wrong does bother me! However, life changes quickly at health insurance, healthcare and pharmaceutical companies. That said, taking unintegrated or cleansed data and propagating it to Hadoop may only help one issue. That would be the issue of getting the data


For thousands of years, the human experience has been recorded by storytellers. Stories tell the tale of our lives: beginning, middle and end. Stories document the triumphs and tragedies of heroes and villains and everything in between. Human beings are storytellers -- it's a trait as uniquely human as an
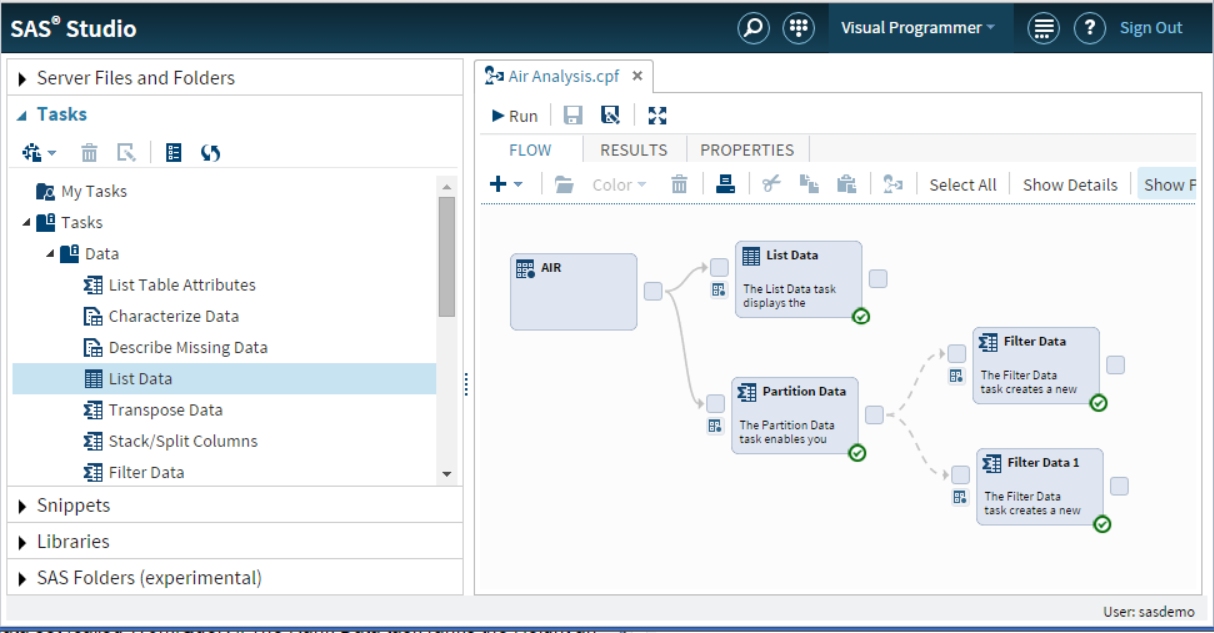

One of the hidden gems of SAS Studio is the ability to run process flows in parallel. This feature really shines when used in a grid environment. Let’s discuss this one step at a time. First, what is a process flow? When working in the Visual Programmer perspective, you have


En su libro “La cuarta revolución industrial” Klaus Shwab menciona que esta revolución tiene 4 efectos principales en las industrias y su inteligencia de negocios: Las expectativas de los clientes están cambiando. Los productos se ven reforzadas por los datos, lo que mejora la productividad de los activos. Se están


The other day I was listening to a Hidden Brain clip about reference bias. Apparently, a new research study found that students exposed to their very best peers became discouraged about their own abilities and performance — and were more likely to drop out. Just on face value, that rang


While you're at SAS Global Forum (or any conference) in Las Vegas, you might have a bit of spare time to do some sightseeing. Therefore I've put together a list & map of interesting things you might want to experience! Below is a snapshot of my map - click it


"I've seen the future of data science, and it is filled with estrogen!" This was the opening remark at a recent talk I heard. If only I'd seen that vision of the future when I was in college. You see, I’ve always loved math (and still do). My first calculus

Most regular readers may have already noticed the release of my new book "Clinical Graphs using SAS", as indicated by the icon of the book cover and the link to the SAS Press page under the "About this blog" section on the right. This book is a result of the various


I've got scale on my mind! While speeding down the rails from Brussels to Paris on the TGV (the sleek, high-speed train), the scale of speed is breathtaking. In previous generations, going from Brussels to Paris for a single-day meeting would have inevitably involved a plane, with check-ins, security, travel


With tax week quickly approaching, tax agencies have been issuing press releases alerting the public they’re holding tax refunds for review longer than in years past. This is a departure for tax agencies. Tax agencies have traditionally lived and died by refund cycle time. Refund cycle time, or getting refunds


While it’s obvious that chickens hatch from eggs that were laid by other chickens, what’s less obvious is which came first – the chicken or the egg? This classic conundrum has long puzzled non-scientists and scientists alike. There are almost as many people on Team Chicken as there are on Team


In the past, configuring a new autoload library for SAS Visual Analytics was a manual process involving steps to create very specific folder structures and to copy and edit scripts and SAS programs. No more! Updates to the SAS Deployment Manager have added a new task that creates and configures new autoload libraries


The journey continues as we hear from the instructors for each of the courses being offered on Thursday and Friday, April 21 and 22 after SAS Global Forum. Next up is Mark Jordan who developed and will teach the Introduction to DS2 and Hadoop course. Why should people get excited