All Posts


In 1969, a human walked on the moon. I remember my parents waking me in the wee hours to watch (albeit bleary eyed) the grainy images on our black and white television as Neil Armstrong set foot on the lunar surface. Heady stuff then and now. In another world-altering advancement,
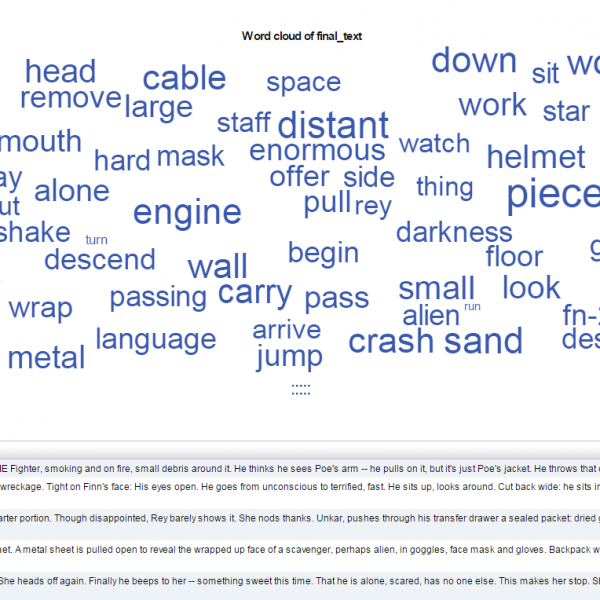

Most folks who know me, know I'm a bit of a Star Wars geek. I've analyzed the original trilogy scripts and documented my findings in a paper called Star Wars and the Art of Data Science. I'm always looking for excuses to get my hands into Star Wars data, and
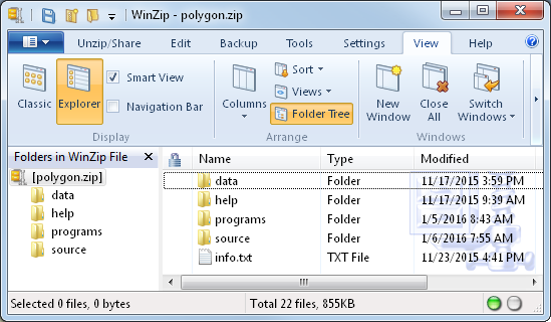

In a previous post I showed how to download, install, and use packages in SAS/IML 14.1. SAS/IML packages incorporate source files, documentation, data sets, and sample programs into a ZIP file. The PACKAGE statement enables you to install, uninstall, and manage packages. You can load functions and data into your


.@philsimon says that it's never too early to think about the IoT and data management.


There’s no such thing as a free app. “What?” I hear you say, “but I download free apps all the time!” So then why do organisations spend considerable time and effort creating free apps? Often their goal is to collect data and turn it into money. Consider this example. There’s


As the excitement of SAS Global Forum begins to die down and we dust off our sequins for another year, it’s time to get back behind the desk. This year at SAS Global Forum we hosted a "Top Tips from Your Favorite SAS Press Authors" lunch where we asked three or four

A few weeks ago I posted an article describing how to display simple Network Diagrams with Curved Links using SGPLOT procedure. The key requirement is that the node positions have to be computed by user. Often, for simple diagrams, nodes can be positioned using a simple layered layout. Separately, I also


The timeline on the latest season of Netflix’s series House of Cards has finally caught up with the real world, and the current plot line regarding President Frank Underwood’s underhanded dealings to win the Democratic nomination has many parallels with the current US primary election coverage saturating TV and print
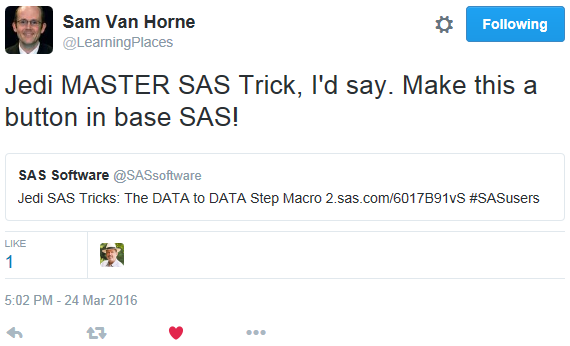

A recent post, Jedi SAS Tricks: The DATA to DATA Step Macro, engendered a lot of response on Twitter. One of the re-tweets included a call to action - make this a button in Base SAS!


In a previous blog, I discussed SAS date and time values, and how date and time formats can be used to your advantage in SAS Visual Analytics. That blog addressed some of the features provided for handling date information, like date formats, date hierarchies, and calculated data items based on time


The Barnett Shale in North Texas hit a historic mark on April 25: Its rig count fell to zero. Two hundred rigs once harvested the 40 trillion cubic feet of natural gas in this massive basin, stretching beneath 17 Texas counties. Today, nothing. This dramatic silence in North America’s second-largest


No importa el tamaño de su organización, usted necesita una solución que le permita explorar todos los datos relevantes que se generan a diario de forma rápida y sencilla, descubriendo oportunidades ocultas e identificando relaciones clave. Todo con el objetivo de tomar las mejores decisiones de manera inmediata y precisa.


At SAS Global Forum in Las Vegas I was asked the question, “What does PROC REPORT do?” It is a simple question, but I hesitated to answer. I’m normally so deep inside the nitty gritty details of PROC REPORT that I don’t often think about what it would be like


Look at the report below. Imagine being asked to allow your users to select which Measure, highlighted in yellow, they are looking at: Income, Expense or Profit. This is a frequent report requirement and I’m going to outline just one of the ways you can design your report to satisfy


The expletive leapt from the lips of the orthopedic surgeon as he entered my hospital room. He was swathed in a green gown, purple gloves, and a white surgical mask – for his protection, not mine. He was clearly upset. “What, exactly, does $#@! mean?” I asked. “It means you’re