All Posts
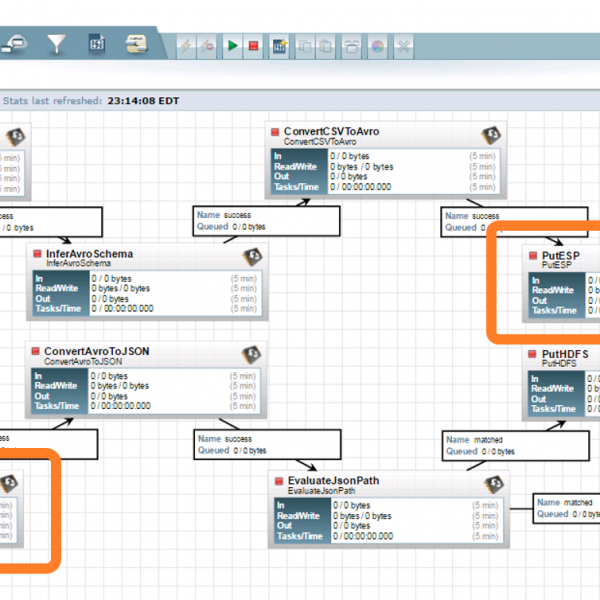

Do you have a need for real-time, streaming analytics? What technology are you considering? How are you going to enable rapid development and deployment of your analytical models all in real-time? SAS has partnered the the Hortonworks HDF team to develop a nifi processor that allows SAS machine learning models and


The fourth and final post in the series about a state government center of analytics concentrates on the big question – what value does analytics bring to business? (Links to previous entries are at the conclusion of this post.) While this “show me the money” question can be answered in


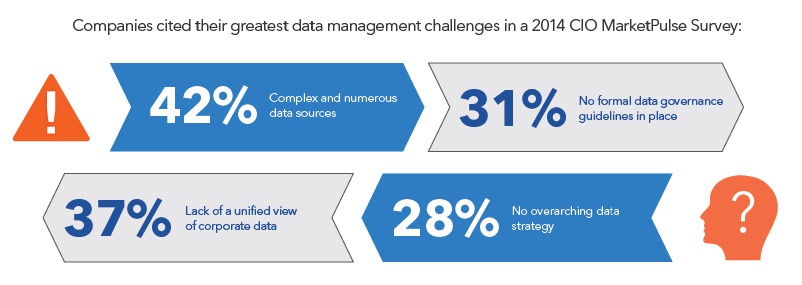
Modernization is a term used to describe the necessary evolution of information technologies that organizations rely on to remain competitive in today’s constantly changing business world. New technologies – many designed to better leverage big data – challenge existing data infrastructures and business models. This forces enterprises to modernize their approach to data

Two of my favorite string-manipulation functions in the SAS DATA step are the COUNTW function and the SCAN function. The COUNTW function counts the number of words in a long string of text. Here "word" means a substring that is delimited by special characters, such as a space character, a
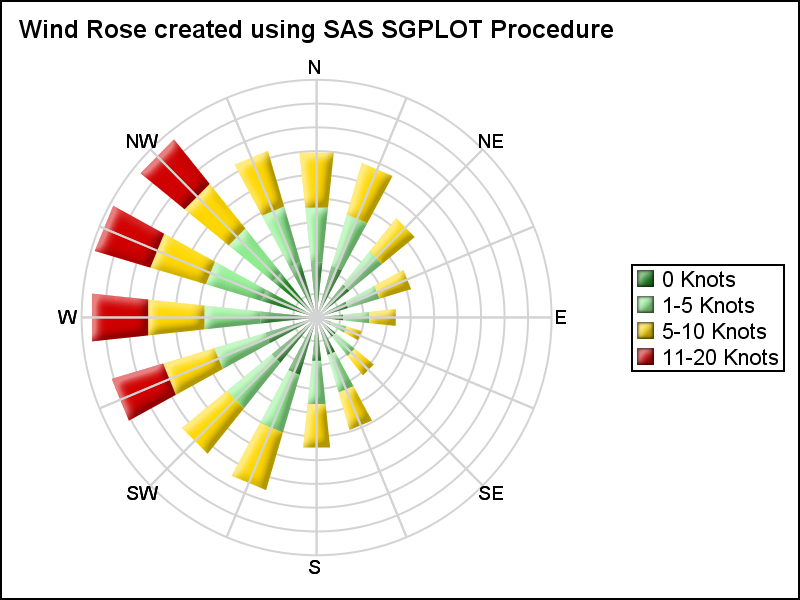

Last week I posted an article on displaying polar graph using SAS. When the measured data (R, Theta) are in the polar coordinates as radius and angle, then this data can be easily transformed into the XY space using the simple transform shown below. x=r*cos(theta * PI / 180); y=r*sin(theta * PI
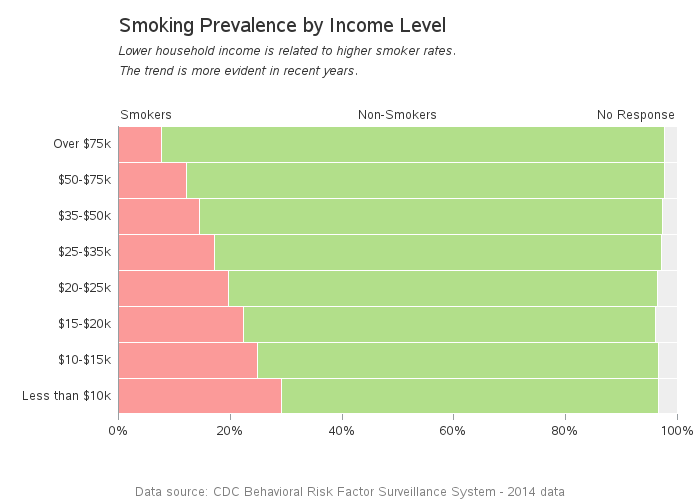

I've noticed fewer and fewer people smoking these days, and was wondering who the last holdouts are. Let's run some numbers and find out... Back in the 1950s, 60s, and 70s it seems like almost everyone smoked. You hardly ever saw the "cool kids" such as James Dean without a cigarette -


Strengthens and stretches legs, knees and ankles. Stretches groins, spine, chest, lungs and shoulders. Stimulates abdominal organs and aids in digestion. Improves balance and increases stamina. Revolved Twist/Side Angle Pose (Sanskrit: Parivrtta Parsvakonasana) From High Lunge pose with left foot forward, place hands at heart center. Make sure the front


Para un mejor desempeño del sector salud, una herramienta clave es la analítica. Si bien el avance de este sector ha sido siempre un factor dependiente de los avances tecnológicos, hoy en día no solo se habla de descubrimientos y desarrollos que respondan a los padecimientos y atención preventiva. Actualmente


The Distributed SAS 9.4 LASR Analytic Server provides a massively parallel processing solution for working very quickly with huge volumes of data. LASR was built from its earliest invocations to provide for incredible scalability and growth. One of the primary criteria which drives the considerations of scalability is load management.

Absent a strong executive presence, most mature organizations will continue to muddle through data integration.


How many companies are using Hadoop as part of their master data management initiative? Come on, raise your hands! Well, maybe a better question is this: How many companies are using Hadoop for enterprise data? From what I have seen, Hadoop is coming along quite nicely. However, it may not be the


SAS Author Derek Morgan is a programming rock star… in more ways than one. Not only has he been a professional SAS programmer in the pharmaceutical industry for almost 30 years and written two editions of The Essential Guide to SAS® Dates and Times, Derek also plays electric bass in


When a person feels sufficiently wronged to lodge a complaint with the Consumer Financial Protection Bureau (CFPB), there’s likely to be some negative sentiment involved. But is there a connection between the language they use and the likelihood they will be compensated by the offending company? At the upcoming Sentiment

“Los que busquen saber cuándo podría darse la próxima crisis financiera deberían ponerse un recordatorio para el 1 de enero de 2018”. Así empieza un artículo elaborado por la agencia de noticias Bloomberg y publicado este año en Portafolio. El texto busca llamar la atención en torno a la importancia


El sector financiero se encuentra en un momento de constantes cambios, sobre todo en materia regulatoria y los ajustes que esto conlleva. Sin embargo, lejos de qué tan convenientes o no resultan para la industria, una pregunta clave y de negocio ante esta situación, es cómo esto llevará a un