All Posts
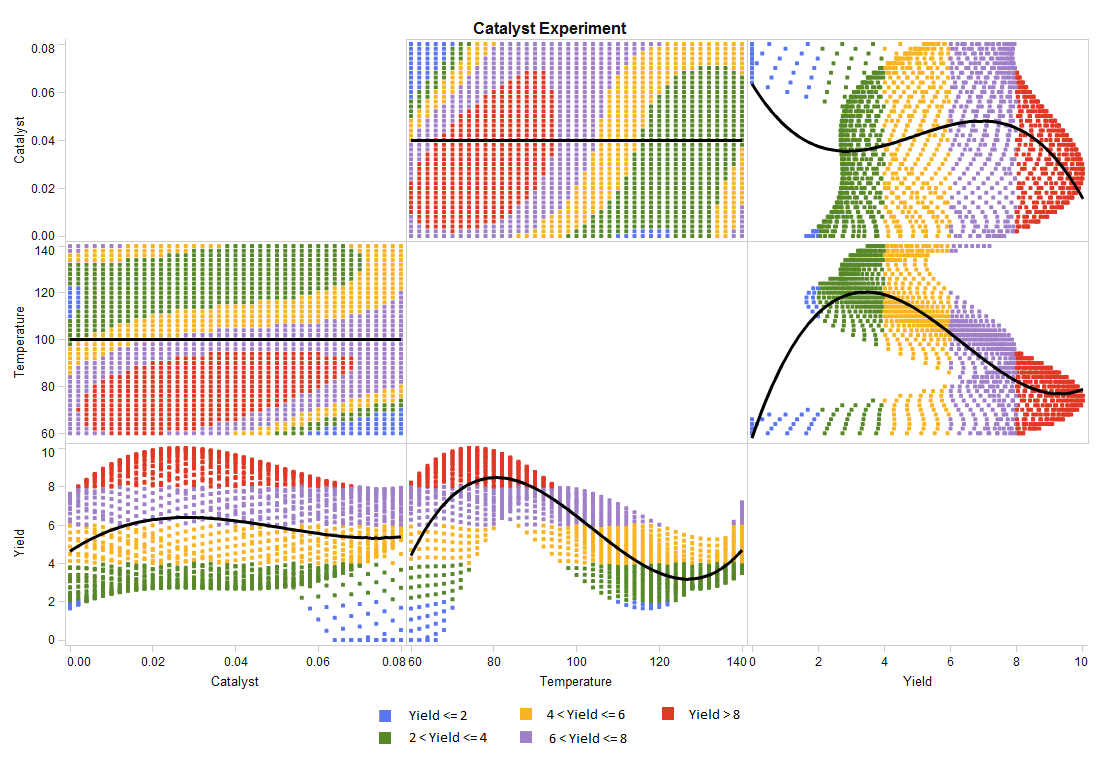

As a practitioner of visual analytics, I read the featured blog of ‘Visualizations: Comparing Tableau, SPSS, R, Excel, Matlab, JS, Python, SAS’ last year with great interest. In the post, the blogger Tim Matteson asked the readers to guess which software was used to create his 18 graphs. My buddy,


.@philsimon advises to be wary of those promising obvious and facile solutions to increasingly challenging governance and privacy issues.


Thanks to Laurie Berzack, MSW, this week's guest blogger for the Work/Life Relationship Series! I've been a matchmaker for more than a decade, I've seen and heard it all. Do you really have no time to meet someone or is that merely an excuse? If you DO want to find the love of

Editor's note: Amanda Farnsworth is Head of Visual Journalism at BBC News and a featured speaker at SAS Global Forum 2017, April 2-5, 2017 in Orlando. There was a best selling book some years ago called “Men are from Mars and Women are from Venus.” It’s a phrase I thought
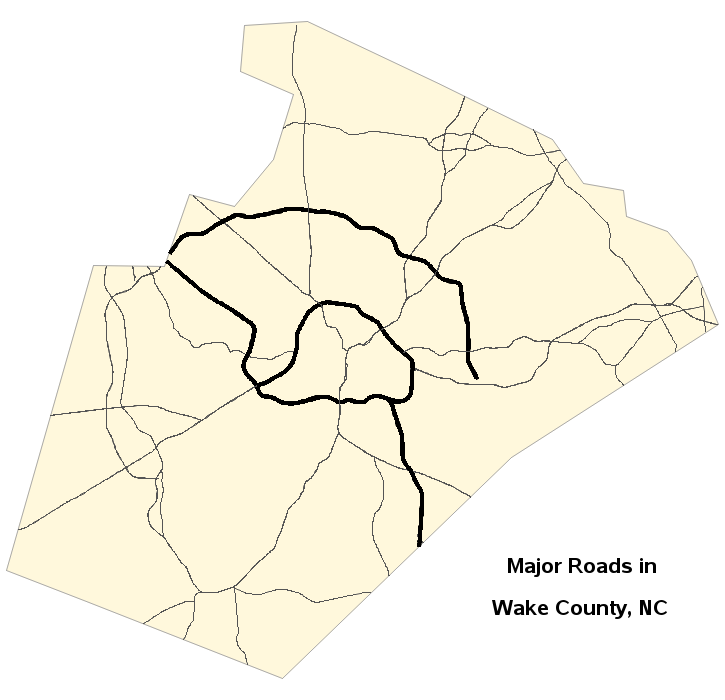

Have you been using the SAS/Graph Gmap procedure to plot your data on maps for years, but never knew you could add roads to your maps?!? Follow along in this blog post, and I'll teach you how... But before we get started, here's a picture of a nice aerial view


Health care fraud prevention is a sticky topic. David Loshin discusses what's needed to balance prompt claims payments with fraud prevention efforts.


Some would say that it's impossible for blind users to see charts and graphs. Those same people might have once said it was impossible for the visually impaired to see the particles that comprise an atom, or galaxies that are billions of light years away. Innovation would prove them wrong


Ok, let’s just get this out of the way first. I love coffee! I mean, I LOOOVE coffee! The smell, the taste, the morning ritual, I love it all! Now, having said that, my goal for this blog is to be as unbiased as possible, and to provide the facts

Sometimes SAS programmers ask about how to analyze quantiles with SAS. Common questions include: How can I compute 95% confidence intervals for a median in SAS? How can I test whether the medians of two independent samples are significantly different? How can I repeat the previous analyses with other percentiles,


Editor's note: This series of blogs addresses the questions we are most frequently asked at SAS Press! In our last post about how to write a good outline, we discussed the importance of developing an outline for your proposed SAS Press book and gave some tips on how to do

What?!? You mean a period (.) isn't the only SAS numeric missing value? Well, there are 27 others: .A .B, to .Z and ._ (period underscore). Your first question might be: "Why would you need more than one missing value?" One situation where multiple missing values are useful involves survey data. Suppose


As you work toward data compliance, Dylan Jones says keep it simple – start with the 4F’s: Function, Flow, Form, Foster. Part 1 looks at the first two.


The SAS® Output Delivery System provides the ability to generate output in various destination formats (for example, HTML, PDF, and Excel). One of the more recent destinations, ODS Excel, became production in the third maintenance release for SAS 9.4 (TS1M3). This destination enables you to generate native Microsoft Excel formatted
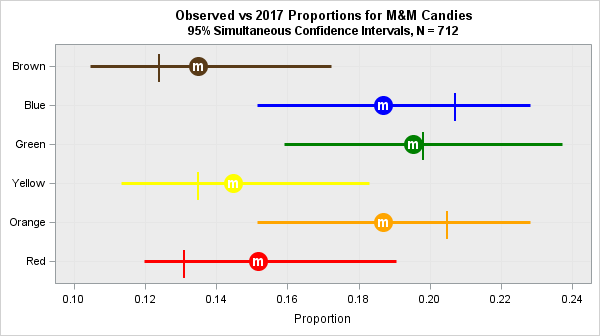
Many introductory courses in probability and statistics encourage students to collect and analyze real data. A popular experiment in categorical data analysis is to give students a bag of M&M® candies and ask them to estimate the proportion of colors in the population from the sample data. In some classes,

Thanks to Sara Thatcher, LCSW, for today's Relationship Series guest blog. So you are married with a toddler…Who has time for a spouse? Becoming a parent completely changes the dynamic between spouses. Sleeping in and cuddling with your beloved on weekends is replaced by little voices requesting your undivided attention