All Posts


Water is in the news more & more lately - people seem to either have too much, or too little, at any given time. Therefore being able to plot rivers and lakes on a map could be a very useful skill to add to your graphical bag of tricks. A few
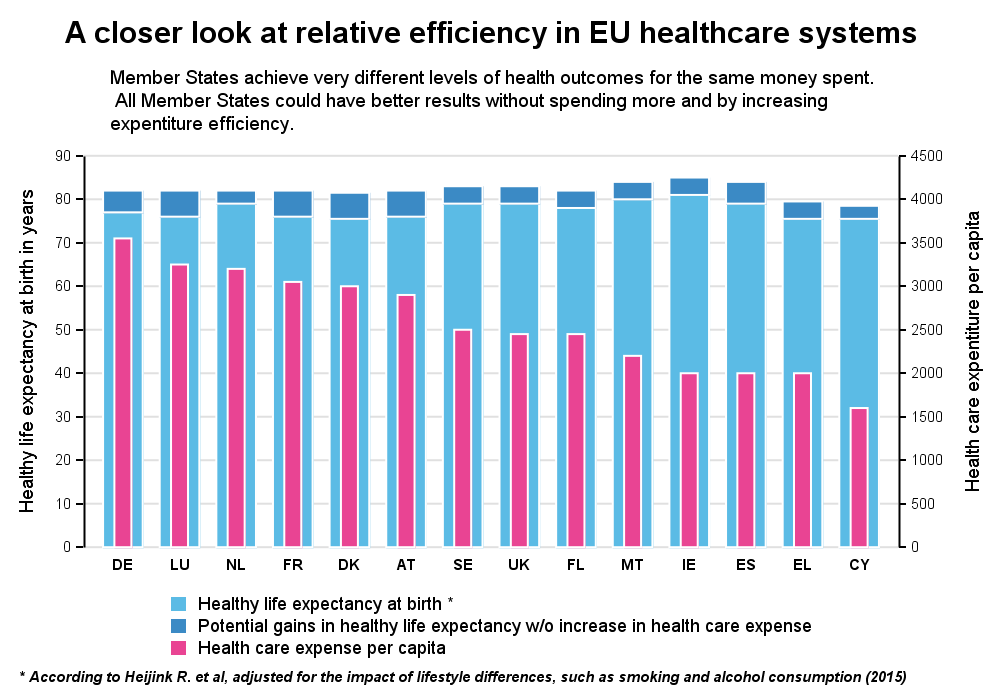

Recently, while browsing health care data, I came across the graph shown below. The graph includes the healthy life expectancy at birth by countries in the EU, along with the associated per capita expenditure. The graph also shows estimate of potential gain in life expectancy by increasing expenditure efficiency. The

When we built our house in Durham ten years ago, I asked the builder if I could make a special request. He was very accommodating. He said he had heard it all. “Can you install a switch to turn off the doorbell?” That he had not heard. His response, “Why
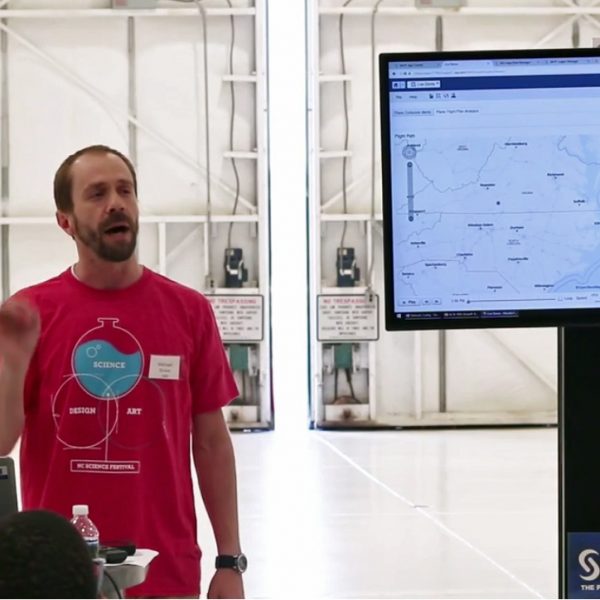

What do you get when you combine analytics, aviation and the Internet of Things? A learning experience that leaves everyone flying high! At Data on the Fly, 25 area high school students had the opportunity to learn how technology has changed – and continues to change – the aviation industry.
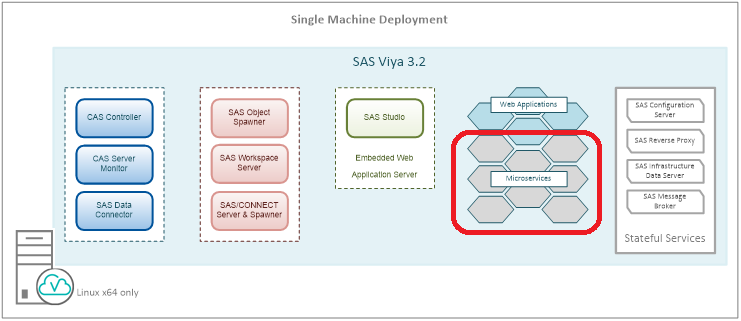

Microservices are a key component of the SAS Viya architecture. In this post, I’ll introduce and explain the benefits of microservices. In a future post we’ll dig deeper into the microservices architecture. What are microservices? When we look at SAS Viya architecture diagrams, we can find, among the new core components,


昨年2016年のSAS Global Forumでも講演して好評だったEmma Warrillowという方が今年も講演されたので紹介します。まずは復習として、彼女が昨年披露した良いデータサイエンティストになるための5つの秘訣を見てみましょう。 ビジネスを理解しなさい:アナリティクスの目的はビジネス課題を解決することである ストーリーを語りなさい:単に分かったことを共有するのではなく、分析結果に基いてビジネスをどうすべきかを議論しなさい 視覚的にストーリーを語りなさい:グラフや図を使用して、より理解を深めることを心がけること よい質問を繰り返しなさい:よりたくさん質問することで、より理解が深まる 新しい技術についていくこと:よりよい表現方法を常に模索すること (2016 SAS Global Forum でのEmma Warrillowの講演より。proceedingはこちら) 「それで?あなたはどう思うの?」と返したくなるデータ分析や仕事の報告、「顧客の理解を深めるための労(繰り返しの問い)を惜しむ」ケースは、ビジネスシーンでよく見受けられますが、あなたの会社ではいかがでしょうか?15年前、あるお客様から、「顧客の顔が見えないのでデータマイニングでなんとかしたい」という相談を受けたのを今でも覚えています。データ自身は何も語ってくれません。事実に基いてストーリーを考え、適切な問いを繰り返すことで初めて洞察(自分たちの顧客に対する理解)が得られるのです。 『問いかけること』 が、とても大事です。 さて、この彼女が今年もプレゼンをし、少しリバイスした秘訣を披露してくれました。レベル感はあまりそろってませんが、どれも、忘れがちなことなので、今一度自分自身の気を引き締めるために取り上げることにしました。 ①スプレッドシートを送付するだけという行為はNG 受け取った人は、無視するか、イライラするか、誤って解釈するだけです。概要、どのように見るべきか、結論は?相手にどうして欲しいのかを伝えることが必要不可欠です。 ②POETを意識すること StorylyticsのLaura Warren より Purpose(目的): このチャートの目的は… Observation(あなたの着眼点): 見て欲しいのは... Explanation(説明): 何を意味しているかというと… Take-away or Transition(要点): 次のステップは… ③アナリティクス・チームのブランディング 多くの企業・組織におけるアナリティクスチームは、PRの問題を抱えています。アナリティクスが真に有効で、またアナリストがちゃんとビジネスを理解していると認知されることが、とても重要です。 ④御用聞きにならないこと 自分がある専門領域のエキスパートであることを自覚し、適切な問い、適切な提案をすることが大事です。 ⑤正しく伝えること ストーリーテリングで人を動かすために、Peter GruberのThe Four Truths of the Storytellerを参考にすると良い。 Truth to the

例年、SAS Global Forumでは2日目の朝は、最新のSASテクノロジーを紹介する『Technology Connection』というセッションで始まりますが、今年は、そのセッションが少し変わった形式になりました。最新のテクノロジーを紹介するだけでなく、その開発を支える社員にフォーカスをあて、どのようにそのテクノロジーが開発されたのかを紹介しながら進められました。 各プレゼンターごとに流された紹介ビデオの中で、今年のTechnology Connectionのメインテーマである、『生涯学習』について語られました。Chief Technology Officerのオリバー・シャーベンバーガーは、もともとCTOになるつもりはありませんでした。実際、彼は林業で博士号を取得しています。しかし統計学への熱意が彼を大学の世界からソフトウェア開発の世界に導き、ハイパフォーマンス・コンピューティング、アナリティクス・プラットフォーム、人工知能そして他の先進技術に携わることになりました。『私は毎日が勉強です。皆さんもそうだと思います。SASも常に革新を続けて新しい製品を生み出し続けています』と彼は、機械が我々の生活を豊かにする象徴としてセグウェイに乗りながら、聴衆に語りかけました。 次世代のテクノロジー - SAS Graphics Accelerator プレゼンターの一人、エド・サマーズは、10歳で網膜色素の異常と診断され徐々に視力を失いました。彼は現在法的盲であり、チャートやグラフを14年間見たことがありません(でも、「ビジョン」を持っています)。彼は、SAS Graphics Accelerator を使用して、データビジュアライゼーションとアナリティクスを視覚障害者にも利用可能にした非常に重要な彼の仕事をデモンストレーションしました。このテクノロジーは、SASのアナリティクス・ビジュアライゼーションを話し言葉と音に変換します。結果は、データを音で表現することで、視覚障害者がデータの様子を『見る』ことができるようになっています。聴衆みんなで目を閉じて、確かにデータが上昇トレンドにあることを確認しました。単にデータの値を読み上げるだけでなく、グラフの右肩上がり具合を音階で表現されることで、まさに『耳で見る』ことができるようになりました。『私たちは皆、それぞれ自分なりの世の中への貢献の仕方があります。データビジュアライゼーションを誰にでも利用可能にすることが、私の役目です』とサマーズは締めくくりました。筆者はこの数日後、SAS本社のCaryの彼の勤務するオフィスのカフェテリアでばったり出会い、しばし歓談しました。やはり、このプレゼンはとても緊張したらしいです。 SASは従来より、このような『ユーザー補助機能』をソフトウェア機能として提供してきています。グラフ上の数字の読み上げ機能なども数年前から実装されています。現在どのような製品でどのような対応がされているかはこちら「Accessibility at SAS」にまとまっているのでご参照ください。今後は、コグニティブ技術+アナリティクスという領域でさらなる進化をしていくことが考えられています。 「エッジ・アナリティクス」 - SAS Event Stream Processing R&Dのシニアディレクターである、ジェリーは、Event Stream ProcessingとInternet of Things の担当であり、彼の車のナンバープレートを、「ESP&IOT」にしてしまうくらい(ビデオにも写っています)彼にとって、ESPは彼の一部であり、ライフワークです。彼は壇上で、自動車業界においてESPがどのように中央のサーバー上や、エッジアナリティクスといわれるデータの発生源で、イベントストリームデータを分析するかをデモンストレーションしました。彼は、コネクテッド・カーに関するユースケースを取り上げ、実際に道路温度が0度以下になったポイントで警告を表示することができることを示しました。彼曰く、『ストリーミングアナリティクスは単に効率を上げるだけではなく、世の中をより安全な場所に変えることができるのです』 Enterprise GuideでDATA Stepデバッガーを使用することで、生産性を向上する ケイシー・スミスはEnterprise Guideの新機能である、DATA Stepデバッガーについて紹介しました。スミスの母親は30年以上もノースカロライナ州立大学でSASを教える教授であり、スミスは幼い頃母親からSASを教わっています。プログラムのバグを修正することはとても時間のかかることであり、またイライラする作業でもあります。そのデバッグ作業をとても簡単にできることを彼はデモンストレーションで披露しました。この機能を開発した理由を彼は次のように述べています。『現実の顧客は、現実の課題を解決している。我々はそれをサポートしたい。』 データ分析においてなによりも大事なのは探索やモデリングのためのデータ準備のフェーズです。特に昨今、正規化された基幹システムからのデータだけではなく、様々な非定型のデータを効率的に正確に結合・整形する必要性が高まっています。そのようなデータに対して(異なる目的のために考案された)SQL一辺倒の利用では非常に非効率です。様々なプログラミング言語を経験した筆者の意見としては、そのようなデータ準備には専用に考案されたSASのData Stepの利用は最も優れた選択の一つだと感じています。それでも細かなデータ加工には複雑なIF条件文のネストなどにおける困難さはつきものです。そのようなデータ加工をステップ・バイ・ステップでデバッグできる、このData Stepデバッガーはとても便利ですので、是非、試してみてください。 FCAAバスケットボールのデータを使用しFactorization Machineで試合結果を予測する ジョージ・シルバは、統計家かつソフトウェア開発者であり、彼は機械学習に携わる自分の仕事を(顧客が価値を出すまでは)まるで赤ちゃんのようだと表現しています。シルバのプレゼンはアマゾン社のインテリジェントなパーソナルアシスタントである、Alexaで行われました。シルバが用意したデモを使用して、CTOのシャーベンバーガーが音声で命令をAlexaに出し、NCAAバスケットボールのデータを探索する様子を披露しました。シルバは試合結果を予測するのにファクタライゼーションモデルという機械学習手法を使用しました。ファクタライゼーション・マシンについては、SGF2017のこちらのセッションが参考になると思います。「Factorization Machines: A New Tool for Sparse Data」


David Loshin discusses two common roadblocks in moving Hadoop from proof-of-concept to production.
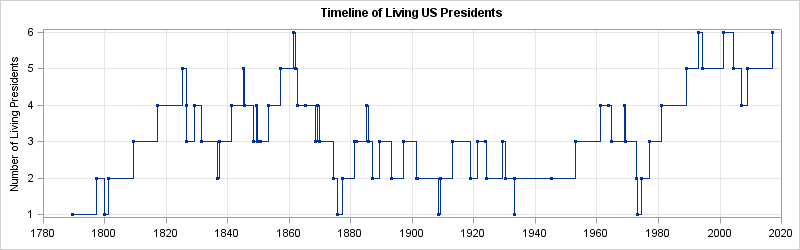

Quick! What is the next term in the numerical sequence 1, 2, 1, 2, 3, 4, 5, 4, 3, 4, ...? If you said '3', then you must be an American history expert, because that sequence represents the number of living US presidents beginning with Washington's inauguration on 30APR1789 and
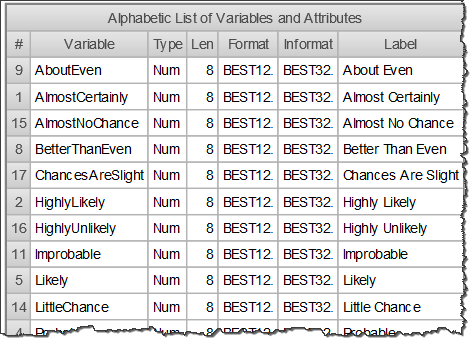

In his recent article Perceptions of probability, Rick Wicklin explores how vague statements about "likeliness" translate into probabilities that we can express numerically. It's a fun, informative post -- I recommend it! You'll "Almost Certainly" enjoy it. To prepare the article, Rick first had to download the source data from
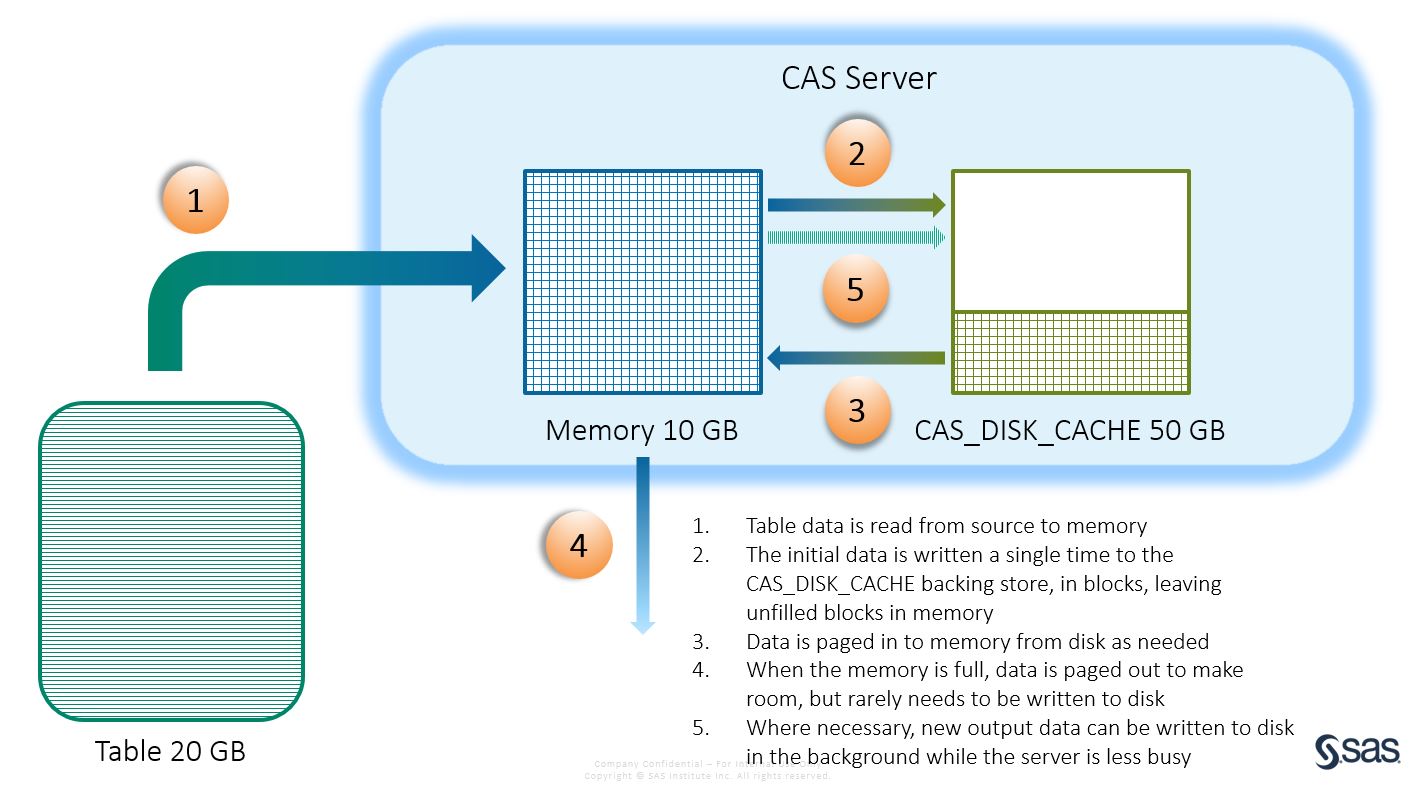

As SAS Viya has been gaining awareness over the past year among SAS users, there has been a lot of discussion about how SAS’ Cloud Analytic Server (CAS) handles memory vs SAS’ previous technologies such as LASR and HPA. Recently, while I was involved in delivering several SAS Viya enablement


Los gurús del mundo corporativo no dejan de repetir un veredicto: en los mercados digitales de nuestros días, quien analice los datos de su consumidor y de su entorno de negocios estará en posición de alcanzar el éxito. Creer en el planteamiento es fácil. Como lo han señalado algunos estudios,


Work Life has chosen the theme “Wholehearted Living” for Employee Health and Fitness month. In her book, “The Gifts of Imperfection”, Brene Brown sets down 10 guideposts for Wholehearted Living. They are all relevant and timely for me, but ultimately I decided to choose one to focus on during the


Kim Kaluba describes how a customer data strategy can help you achieve an omnichannel vision.


Stretches shoulders, hamstrings and calves while strengthening arms, core and back; Calms the mind! Dolphin Pose (Sanskrit: Ardha Pincha Mayurasana) Start on hands and knees with toes curled under – wrists under shoulders and hips over knees. Core is engaged and drawing in towards spine. Shoulder blades are sliding down