All Posts

When I first learned to program in SAS, I remember being confused about the difference between CLASS statements and BY statements. A novice SAS programmer recently asked when to use one instead of the other, so this article explains the difference between the CLASS statement and BY variables in SAS


Con el fin de establecer el rumbo que tomaron sus compañías para seguir siendo competitivas y rentables, los líderes empresariales están atentos a una gran cantidad de factores internos como externos. El ambiente socioeconómico y político, los cambios en los patrones de consumo, el uso de nuevas tecnologías, e incluso


Two years ago my husband and I found ourselves on the eve of Valentine’s Day with no plans. It fell on a weekend that year so there was plenty of time to do something. The act of giving gifts isn’t necessarily either of our love languages. We also have very


전 세계가 눈 한 번 깜짝할 사이도 안 되는 찰나의 순간에 울고 웃습니다. 바로 냉혹해서 더 감동적인 스포츠 경기 때문인데요. 스포츠에서 정밀하게 시간을 측정하는 전문가 ‘타임 키퍼’의 역할은 매우 중요합니다. 덕분에 동계 스포츠의 꽃인 스피드 스케이팅은 1000분의 1초까지 시간을 측정할 수 있을 정도로 관련 기술이 빠르게 발전하고 있죠. 전 세계


Todd Wright summarizes several GDPR-related blog posts that cover topics ranging from what the GDPR means to how you can manage consent.


2월, 봄기운을 느끼기에는 아직 추운 날씨지만 꽃 수요가 집중된다고 하는데요. 바로 2월 14일 발렌타인 데이와 졸업식 시즌 때문입니다. 올해도 어김없이 거리는 로맨틱한 분홍빛으로 물들고 있는데요. 이맘때면 초콜릿, 셔츠, 넥타이, 향수 등 선물 고르기에 골머리를 앓는 분들도 많아지죠. 물질만으로 사랑하는 마음을 다 표현할 수는 없기에 더욱 어려운 일인 것 같습니다. 그런데


In the hype and excitement surrounding artificial intelligence and big data, most of us miss out on critical aspects related to collection, processing, handling and analyzing data. It's important for data science practitioners to understand these critical aspects and add a human touch to big data. What are these aspects?
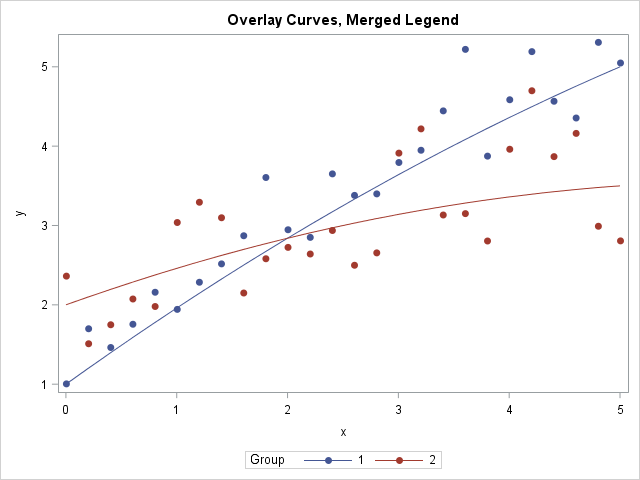
Did you know that SAS can combine or "merge" a symbol and a line pattern into a single legend item, as shown below? This kind of legend is useful when you are overlaying a group of curves onto a scatter plot. It enables the reader to quickly associate values of


¿CÓMO APLICAR EL ANÁLISIS DE DATOS PARA MEJORAR LA ESTRATEGIA DE VENTAS EN SAN VALENTÍN? San Valentín está a la vuelta de la esquina e históricamente ésta es una de las fechas preferidas por las empresas de retail por el incremento de las ventas. Estudios indican que en


As the old saying goes, the only constant is change. The corollary that I’ll add is this: and the pace of change feels like it's directly proportional to Moore’s Law. Utilities used to be favorites for conservative investors. Smooth. Steady. When there was change, it was incremental. But today, uncertainty


This is a guest blog by Hayden Dawes, LCSW, LCAS-A, as part of the Work/Life February Relationships Series. We offer our sincere thanks to Hayden for volunteering to contribute! As we head into Valentine's week of 2018, I am struck at the differences as to how children and adults typically celebrate


Want to see my newly minted certified professional badge? Scroll down to take a peek. Yes, I managed to successfully complete the Base SAS Programmer certification exam… with, ahem, flying colors I might add. Here are my tips to tackle the Base SAS certification exam: 1. Get clear on the

우리 모두가 개인 비서의 도움을 받는 세상, 상상이 가시나요? 어쩌면 빠르게 다가올지도 모르겠습니다. 바로 가상 비서, 챗봇 기술의 발전 덕분인데요! 챗봇(chatbot)은 채팅(chatting)과 로봇(robot)의 합성어로 자연어 처리(NLP; Natural Language Processing)와 인공지능(AI)을 이용해 사람과의 대화를 시뮬레이션하고 응답을 도출하는 컴퓨터 프로그램입니다. 쉽게 말해 사람의 이야기에 알맞은 답이나 정보를 제공할 수 있는 기계죠. 단순하고 자동화된 작업을 처리할
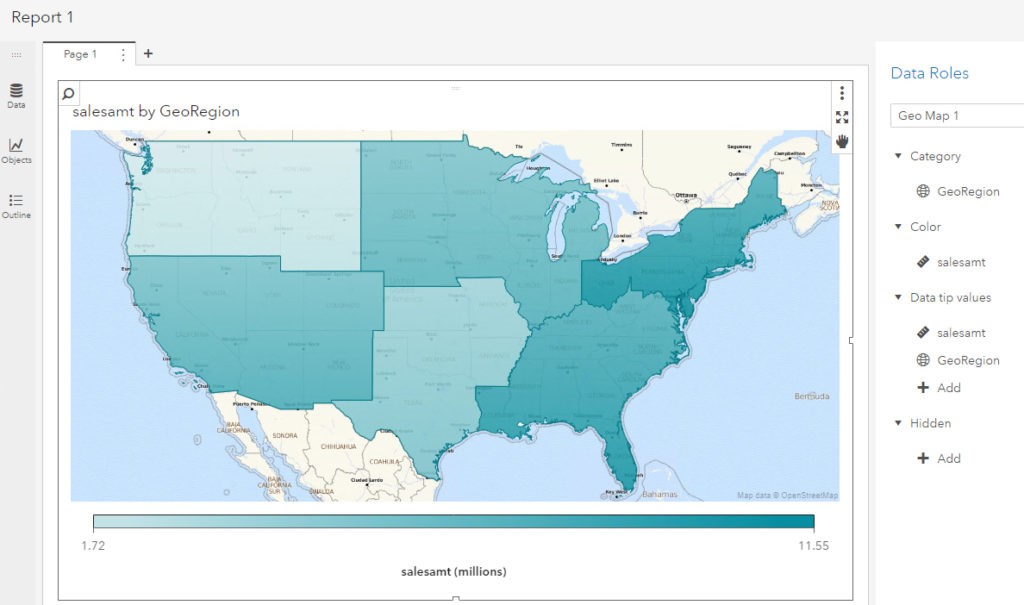

In my last article, I worked with an example of using custom polygon data to create a regional geo map in SAS Visual Analytics 7.4. In this article, I will use almost the same example to illustrate the ease of implementing custom polygons to produce the same regional map in
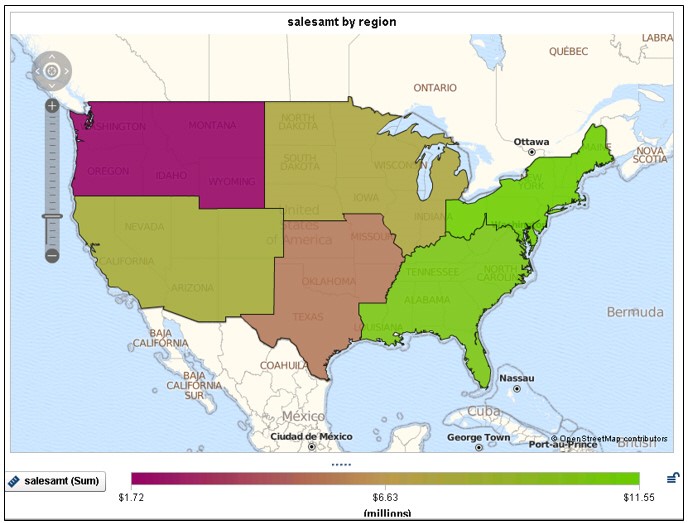
By default, SAS Visual Analytics 7.4 supports country and state level polygons for regional geomaps. In SAS Visual Analytics 7.4, custom shape files are now supported, as well. This means that if a site has their own custom polygon data that defines custom regions, it’s possible to create a region