All Posts


American readers may know that the ongoing 2018 international soccer/football tournament is a big deal in other countries. But it's hard to grasp just how ubiquitous and important it is when there's no other event like it in the United States. The best way I can describe it is if the


Atualmente, nas organizações existe um enfoque muito grande, na procura da melhor forma de tirar partido das novas capacidades e paradigmas analíticos que têm surgido nos últimos anos. Dois fatores têm sido fundamentais como força motriz da utilização da analítica ao serviço das organizações: A disrupção do digital e a


With all the technology advancements and innovative trends driving Industry 4.0 right now, you might expect geeky topics like the Internet of Things (IoT) or artificial intelligence (AI) to be the hottest topics of discussion among industry leaders. Instead, many leaders are still more focused on workplace culture. And here’s
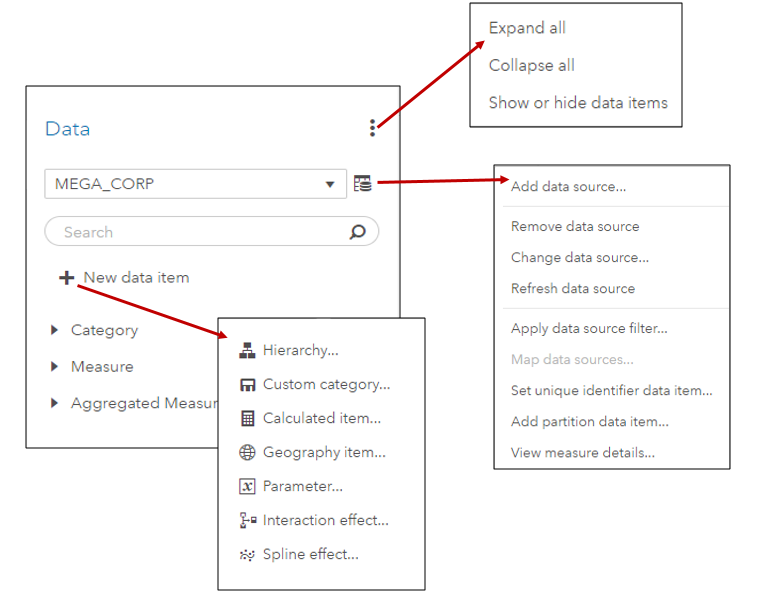

In SAS Visual Analytics 8.2 on Viya 3.3, there are a number of new data features available. I’ll cover a few of these new features including the new data plan and data item features in SAS Visual Analytics in this blog.


SAS llegó al país en 1998 con el objetivo de entregar soluciones para que las empresas pudieran administrar sus datos, que son su activo más importante. Desde ese momento, y a hoy, se ha encargado de entregarle a las organizaciones colombianas The Power to Know (el poder de saber), mientras


Su empresa lanzará en unas semanas un producto que, a su juicio, es innovador y despertará el interés de la gente. La campaña de awareness arrancó hace ya varios días y los clientes potenciales están visitando su sitio web para conocer más detalles, así como la fecha en que estará


El pasado 17 de junio Colombia eligió a Iván Duque, el candidato del Centro Democrático, como su próximo presidente. El ganador junto con su gabinete, que ejercerán desde el próximo 7 de agosto y hasta el 2022, recibirán un país que aunque se recupera económicamente, aún enfrenta grandes retos en


Ballpark Chasers A cross-country trip is pretty much an all-American experience, and so is baseball. Traveling around the country to see all 30 Major League Baseball (MLB) stadiums is not a new idea; there's even a social network between so-called "Ballpark Chasers" where people communicate and share their journeys. Even


What do the New York Mets, the Orlando Magic and the Boston Bruins all have in common? They all use SAS analytics to gain deeper insights into athlete recruitment, retention, performance, safety and more. And after seeing the success teams like these have had using analytics, collegiate sports are turning


There are two sides to feeding children: one is to ensure they are nourished so they can grow and thrive and the other is to instill in them a healthy, lasting relationship with food. Simple enough, right? Not exactly! In reality, these two goals are often at odds with each
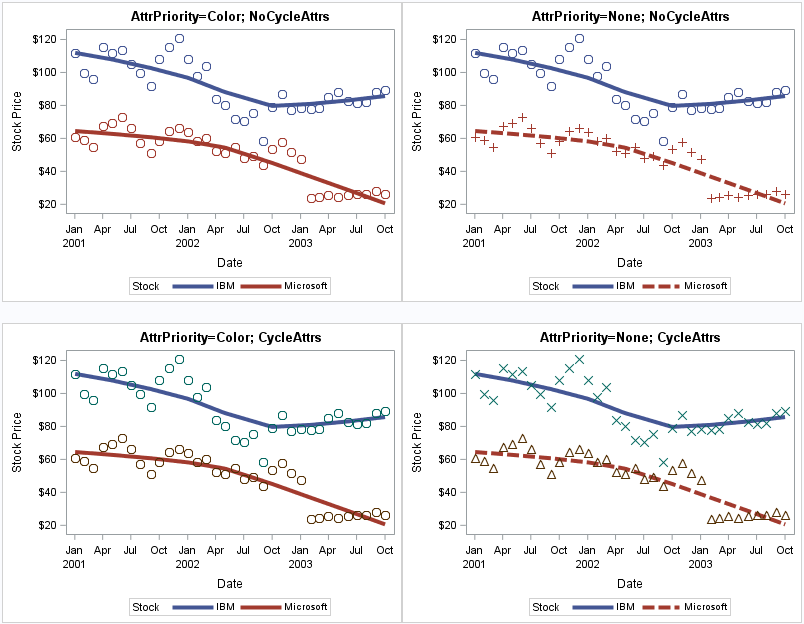

If you use PROC SGPLOT to create ODS graphics, "ATTRS" are everywhere. ATTRS is an abbreviation of "attributes." Most options that change the attributes of a graphical element end with the ATTRS suffix. For example, the MARKERATTRS option modifies attributes of markers, the LINEATTRS option modifies attributes of lines, and


Quando falamos em analíticas, do seu impacto e oportunidades nas organizações, poucos sectores são tão impactados como o sector financeiro (banca e seguradoras). Não só pela quantidade de dados envolvidos, mas também pela inerência do negócio. Mas isto é algo que está a mudar. O tema esteve em debate no


We have updated our software for improved interpretability since this post was written. For the latest on this topic, read our new series on model-agnostic interpretability. Assessing a model`s accuracy usually is not enough for a data scientist who wants to know more about how a model is working. Often


미래에 대한 좋은 소식이 있습니다. 어디선가 들어봤을지도 모르지만 인공지능(AI)과 함께하는 미래 일자리가 모두 절망적이고 암울한 것만은 아닙니다. 말콤 프랭크(Malcolm Frank)의 연구 기반 저서 ‘기계가 모든 것을 할 때 무엇을 해야 하는가(What to Do When Machines Do Everything’는 데이터를 통해 이를 증명합니다. 또 학생과 근로자는 새로운 교육 접근법을 통해 인공지능과 함께하는 미래에 더욱


Kim Kaluba explains why good customer data management starts with trusted data quality.