All Posts
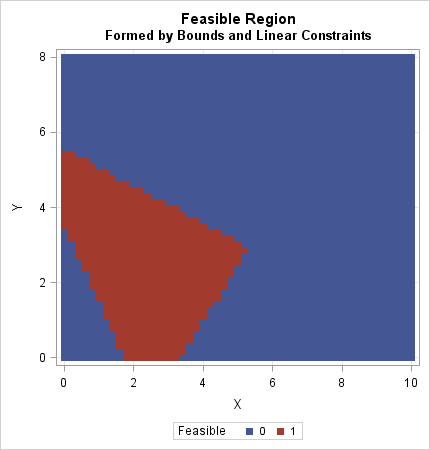

When solving optimization problems, it is harder to specify a constrained optimization than an unconstrained one. A constrained optimization requires that you specify multiple constraints. One little typo or a missing minus sign can result in an infeasible problem or a solution that is unrelated to the true problem. This

With today being an election day here in the US, I see a lot of people wearing the 'I Voted' sticker. This got me wondering if I could create my own sticker ... using SAS software and simple graphics primitives. :-) So I started by using Proc Gslide to create
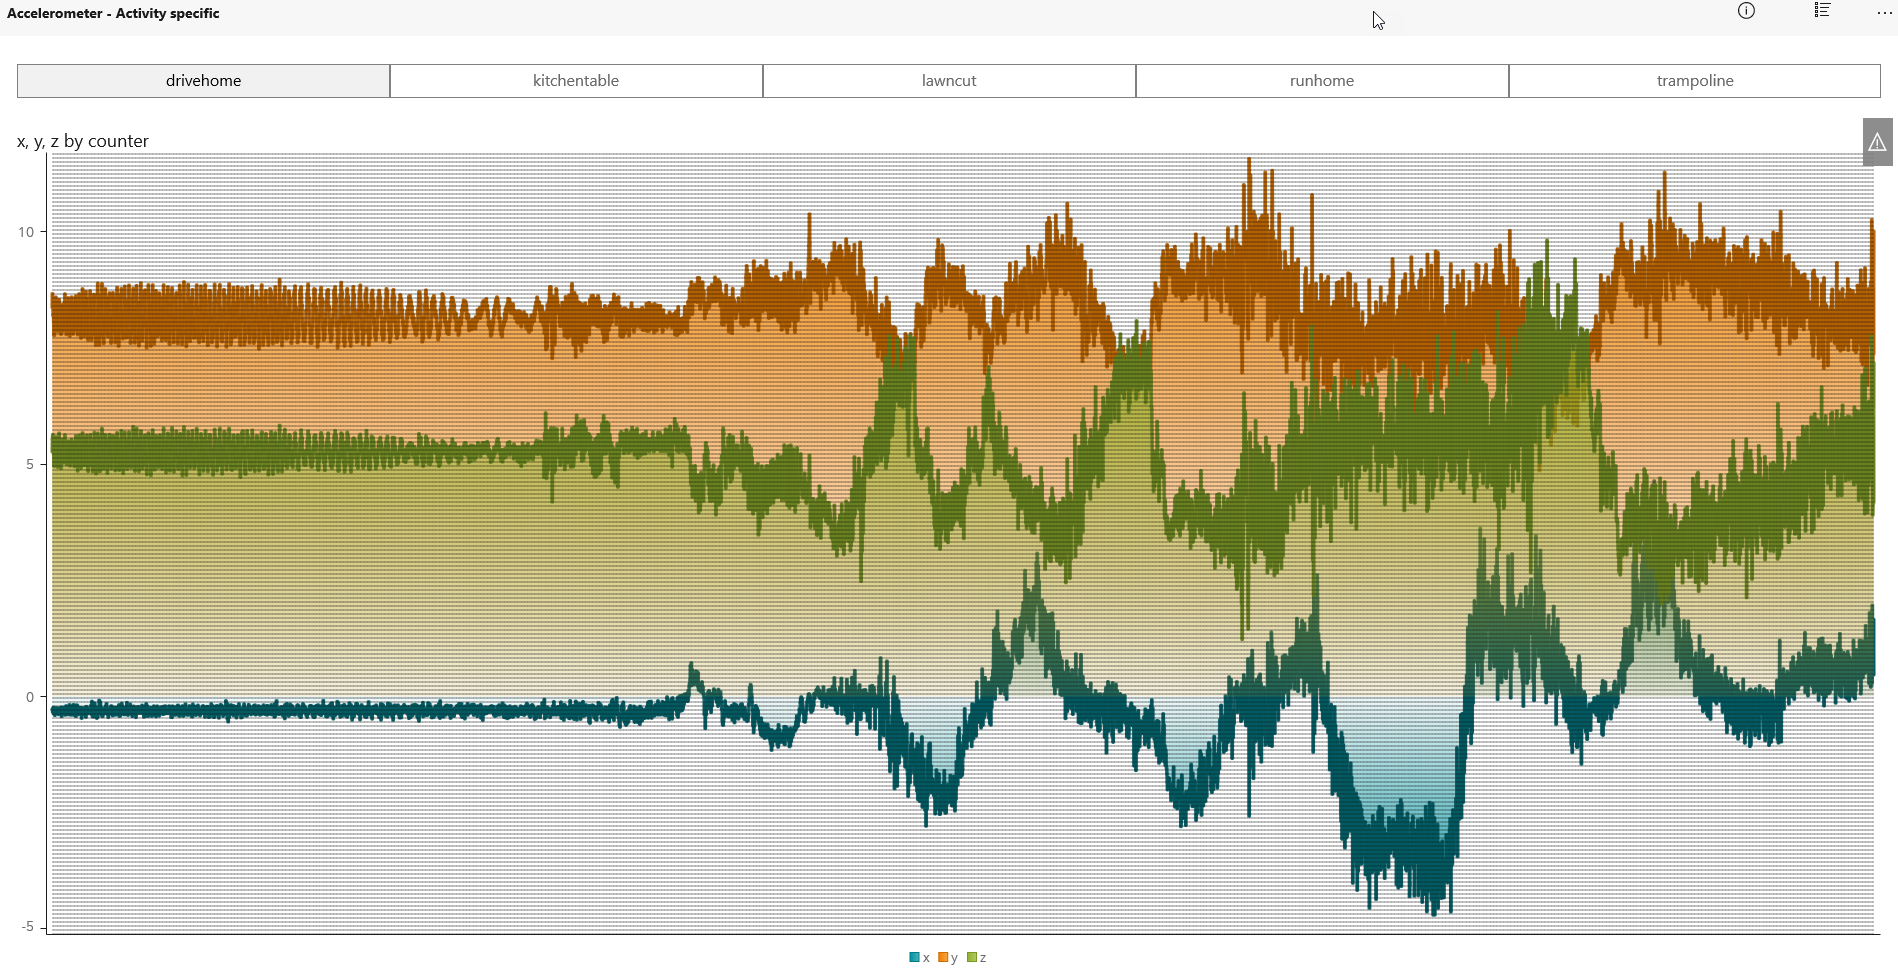

I've collected accelerometer data with a third-party app. I've used some SAS tricks to import all of my data readings in a single step. Now I'm ready to create a report of these data in SAS Visual Analytics.

You can communicate with various clients (SAS, Python, Lua, Java, and REST) in the same place using SAS® Cloud Base Analytics Services (CAS) in SAS Viya. But before you can do any analysis in CAS you need some data to work with, and a way to get to it. Check out this dynamic data selection tip using SAS Viya and Python.


인공지능(AI)은 1950년대부터 머신러닝, 링크 걸기 시작 딥러닝(deep learning), 인지 컴퓨팅(cognitive computing)이 점차 발전하면서 우리와 꽤 오랜 시간을 함께 해왔습니다. 최근 달라진 점이 있다면 아마 활용할 수 있는 데이터의 양이 어마어마하게 늘었다는 것인데요. 방대한 양의 데이터 덕분에 오늘날 과거에는 불가능했던 방식으로 인공지능 기반의 모델을 학습시킬 수 있게 되었습니다. 이러한 인공지능은 지금의 세상과 거대한 데이터를 이해하는
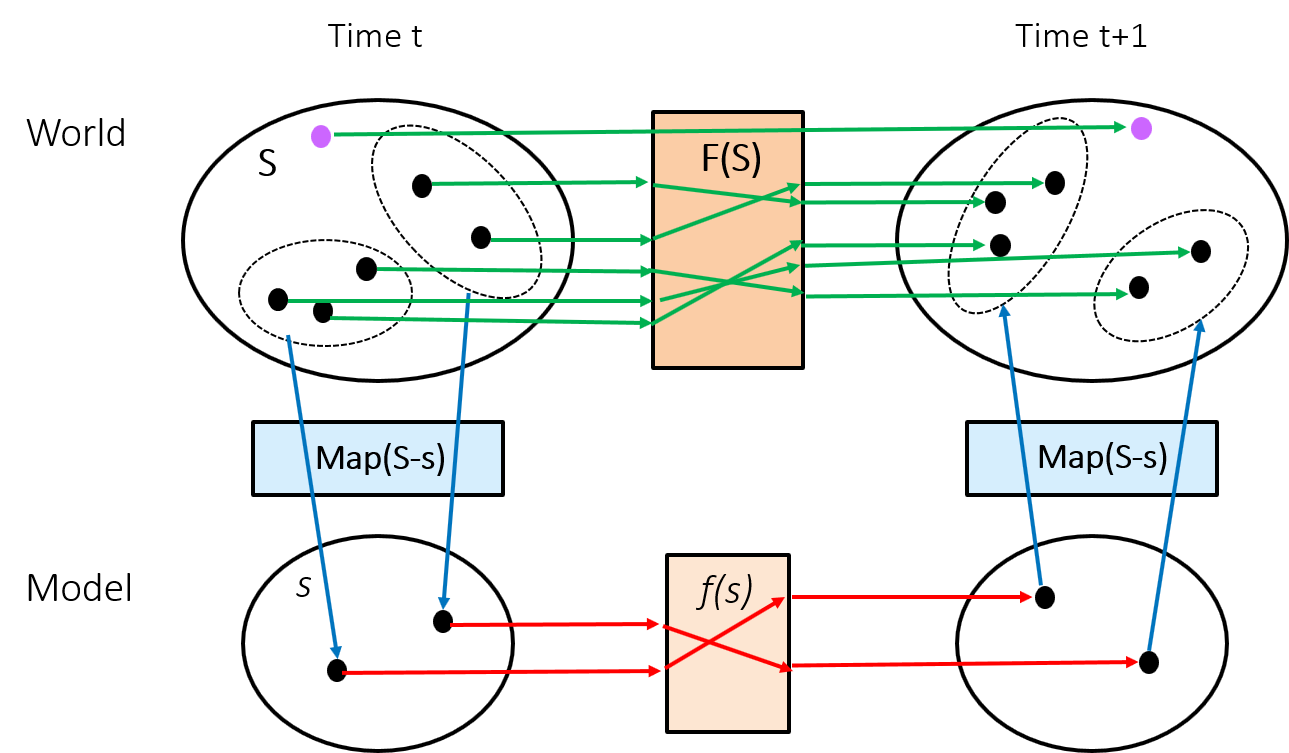

What’s the most important component of analytic analysis? The data? The model? The deployment? Getting the business problem right? All the above? Or does it simply depend on who you ask? While the model gets all the attention, and the data requires most of the effort, there is that step


“Siento que este tipo lo que quiere es resolver mi problema” En mi opinión la elección de nuestro cliente depende principalmente de tres factores: 40% de nuestro producto, 40% de nuestro trabajo, 20% de cuestiones que están fuera de nuestro control. Podemos discutir horas respecto a la precisión de estos


What does it take to see the work we do as more than a source of income? It's about looking beyond the day-to-day tactical items of a to-do list. For our employees, it's about connecting to the significant contributions SAS makes to the world. And our own Jared Peterson experienced
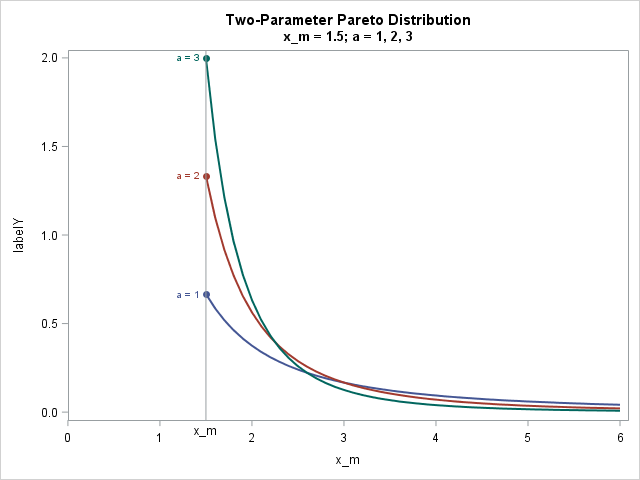
Will the real Pareto distribution please stand up? SAS supports three different distributions that are named "Pareto." The Wikipedia page for the Pareto distribution lists five different "Pareto" distributions, including the three that SAS supports. This article shows how to fit the two-parameter Pareto distribution in SAS and discusses the
In their new book, SAS Viya: the R Perspective, Kevin Smith and Xiangxiang Meng provide an overview of using R with the SAS Viya platform. Read on to see how R programmers can use CAS.


Los avances tecnológicos, las expectativas de los clientes y las regulaciones que redefinen el mercado, han sido puntos clave para que el sector de los seguros se enfoque en el crecimiento de sus ventas, su rentabilidad y la lealtad y el cuidado de sus clientes. ¿Qué ha pasado entonces? las
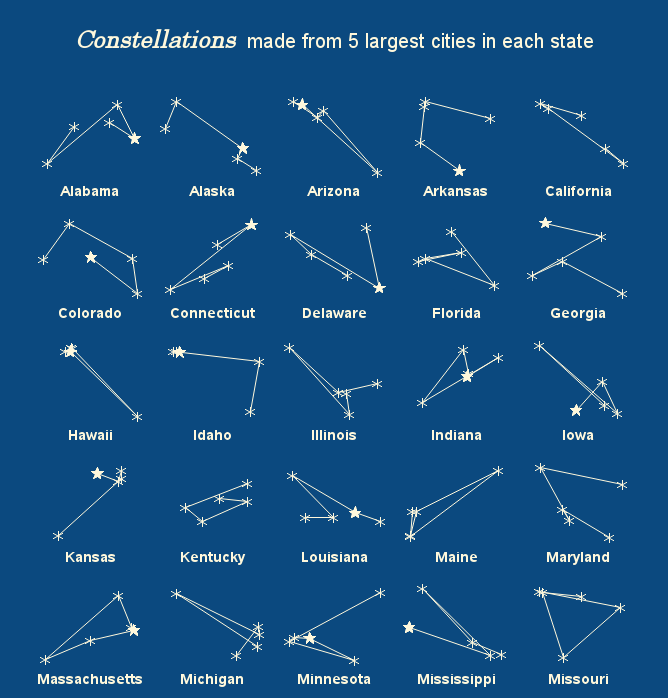
Who says technical people can't have fun!?! Similar to Throwback Thursday / #TBT (when people post one of their old/nostalgic photos on social media), I like the tradition of Fun Friday when I use a fun data topic to test our software - a test can be just as rigorous using


Health care is facing an unprecedented need to reform, drive quality and cut costs. Growth in targeted, specific treatments and diagnostic technology, coupled with a rise in people with long-term and multiple chronic conditions, is creating unsustainable demand on the system. To thrive – or even merely survive – health


SASでは、従来からオープン・AIプラットフォームであるSAS Viyaの機能をPythonから効率的に活用いただくためのハイレベルなPython向けAPIパッケージであるDLPyを提供してきました。 従来のDLPyは、Viya3.3以降のディープラーニング(CNN)と画像処理(image action set)のために作成された、Python API向けハイレベルパッケージです。 DLPyではKerasに似たAPIを提供し、より簡潔なコーディングで高度な画像処理やCNNモデリングが可能でした。 そして、この度、このDLPyが大幅に機能拡張されました。 最新版DLPy1.0では、以下の機能が拡張されています。 ■ 従来からの画像データに加え、テキスト、オーディオ、そして時系列データを解析可能 ■ 新たなAPIの提供: ・ RNN に基づくタスク: テキスト分類、テキスト生成、そして 系列ラベリング(sequence labeling) ・ 一般物体検出(Object Detection) ・ 時系列処理とモデリング ・ オーディオファイルの処理と音声認識モデル生成 ■ 事前定義ネットワーク(DenseNet, DarkNet, Inception, and Yolo)の追加 ■ データビジュアライゼーションとメタデータハンドリングの拡張 今回はこれらの拡張機能の中から「一般物体検出(Object Detection)」機能を覗いてみましょう。 SAS Viyaでは従来から画像分類(資料画像1.の左から2番目:Classification)は可能でした。例えば、画像に映っている物体が「猫」なのか「犬」なのかを認識・分類するものです。 これに加えて、DLPy1.0では、一般物体検出(資料画像1.の左から3番目:Object Detection)が可能になりました。 資料画像1. (引用:Fei-Fei Li & Justin Johnson & Serena Yeung’s Lecture
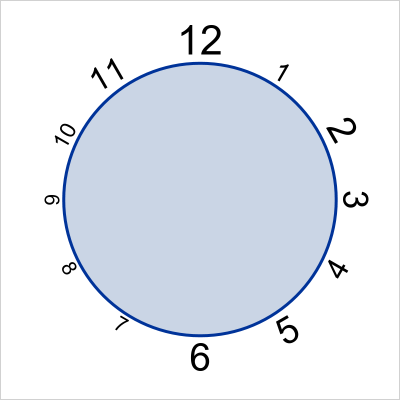

The TEXT plot was introduced with SAS 9.4M2 to facilitate placement of text strings in a graph. This replaces the MARKERCHAR feature of the SCATTER plot statement, which is still available, but it is better to use TEXT plot in most cases. The syntax is: text x=column y=column text=column </