All Posts

As a SAS programmer, you are asked to do many things with your data -- reading, writing, calculating, building interfaces, and occasionally sending data outside of SAS. One of the most popular outputs you may be tasked with creating is likely a Microsoft Excel workbook. Have you ever heard, “just
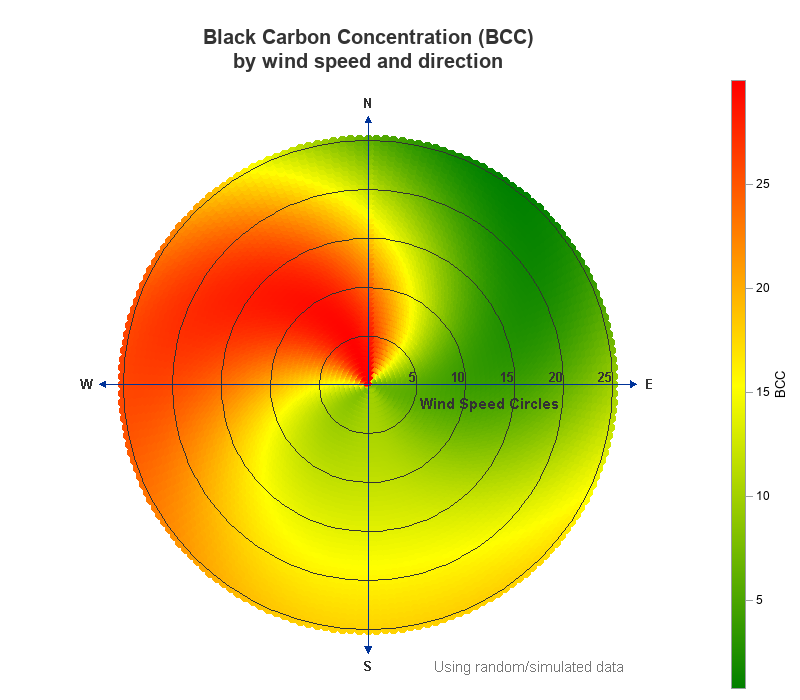

A few years ago Sanjay showed how to create a polar graph by creating a gtl template, and then plotting it using Proc SGRender. These days, Proc SGPlot has all the functionality you need to create this graph, therefore I've rewritten the example to just use SGPlot. And while I


Banks increasingly face challenges that put pressure on the bottom line. In this post, I’ll focus on the threats that affect the risk departments of banks. In my view, there are three critical areas. The 3 core challenges 1. Regulatory and accounting demands The first is increased regulatory and accounting


Analytics can help today’s leaders transform banking for the digital age without compromising on efficiency It’s no secret that challenger banks and fintech companies are changing the banking industry as we know it. The main issue for today’s banking leaders is not that customers are switching to new high-street providers,


Your preconception health can have a huge impact on your fertility. And, your health at the time of conception will impact your child’s health. For these two reasons alone, optimizing health before getting pregnant is really important.
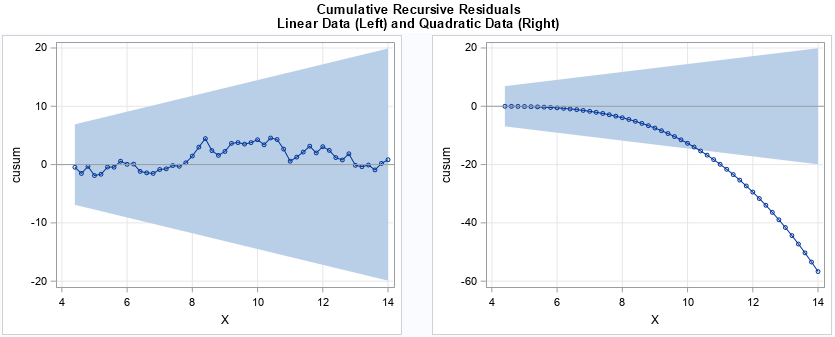

The CUSUM test has many incarnations. Different areas of statistics use different assumption and test for different hypotheses. This article presents a brief overview of CUSUM tests and gives an example of using the CUSUM test in PROC AUTOREG for autoregressive models in SAS. A CUSUM test uses the cumulative

SAS Japanでは昨年末より”Data for Good”を目指す学生コミュニティ「SAS Japan Student Data for Good community」を運営しています。このコミュニティでは世界の絶滅危惧種や通勤ラッシュ時の鉄道混雑緩和など、データを活用した社会課題の解決に取り組んでいます。 活動を更に加速させるために、Data for Goodのケーススタディを通じた課題設定・アナリティクスの適用法を学ぶ勉強会を開催しました。 この記事では勉強会の中で取り上げた事例を2つ紹介します。 1.ネパール地震でのIOMによる支援 1つ目の事例はSAS USが国際移住機構(IOM)と協力して行ったネパール地震における復興支援です。 2015年4月25日に起きたネパール地震では約90万棟が全半壊し、多くの住民が仮設キャンプ場での生活を余儀なくされました。IOMは現地でキャンプ場の運営等の支援活動を行っていましたが、6月から始まる本格的な雨季を前に風雨を凌げる住居の提供が喫緊の課題でした。 IOMの要請を受けたSAS USは国連商品貿易統計データベース(UN Comtrade)を利用した各国のトタン板の生産能力を分析し、その結果迅速なトタン板の供給を実現しました。この事例からは次の事が学べます。 データの可視化によって意思決定の支援ができる この事例では住宅復興支援に必要な物資の素早い調達という課題に対し、国連商品貿易統計データベースの300万件ものデータをSAS Visual Analyticsで分析し仕入れ先を可視化することで解決しています。 複雑で膨大なデータも適切に分析・要約・可視化することで経験ではない科学的根拠に基づいた新たな知見を導くことができます。 2. 大学中退率の改善 2つ目の事例はData for Goodを推進する社会団体であるDataKindが取り組んだアメリカのとある大学の中退率の改善です。 日本の大学と比べアメリカの大学は中退率が高く、 National Student Clearinghouseによると約半数近くの学生が学位を取得せず辞めていきます。DataKindは大学の依頼を受け、どの要素が中退に影響を与えるのか、また中退の危険性のある学生を事前に特定することに挑みました。 デモグラフィックデータや学業成績などの学生情報を10年分以上分析したところ、入試の成績と卒業は関連が確認できなかった一方で、GPAや専攻などが卒業に影響を与えていることが判明しました。 この結果を踏まえ20以上もの異なるアプローチのモデルを生成し改良を重ねた結果、生徒の中退を高い精度で予測するモデルを生み出しました。 詳しい内容は原文をご覧ください。この事例からは次の事が学べます。 未来を予測して事前に対処する この事例では、中退率の改善という課題に対して統計分析や機械学習を駆使し事前に中退リスクのある学生を特定することで解決を目指しています。事前の把握ができれば大学側は効率的な学生への支援が可能となるはずです。 上記以外にも参加者それぞれが事例紹介を行い、課題に対してのアナリティクスを用いたアプローチ方法を学びました。勿論データを分析のみで課題をすべて解決することはできませんが、従来の方法では成し得なかった突破口を生み出すことが実感でき、私たちの現在の取り組みに大きな示唆をもたらした有意義な会となりました。 SAS Japan Student Data for Good communityでは引き続き学生の参加者を募集しております。社会貢献を目指す活動を通してデータサイエンティストの役割である「課題の設定」から「データを用いた解決法の提示」までの一連の流れを経験できます。 興味をお持ちでしたら以下のアドレスまでご連絡ください。 JPNAcademicTeam@sas.com


This article demonstrates the ODS Excel destination’s flexibility and how you can modify its default behavior by using the SHEET_INTERVAL= option.


In a college class on addiction I learned about the “gas/brake” metaphor for how our bodies respond to substances (think stimulant- puts on the gas / depressant – puts on the brake). Our bodies want to maintain homeostasis. If a substance causes one response (gas), then our body will cause

From saving cheetahs to preserving fresh water systems, analytics plays a role in many inspiring conservation projects around the world. Read on to learn about a few of our favorites. 1. Protecting animals from extinction Learn how analyzing footprints could help save cheetahs in Namibia and other endangered animals around


No início deste mês tive o prazer de participar como speaker no evento Platform Roadshow – Road2AI promovido pelo SAS. Nesta conferência foram abordados diversos temas interessantes, entre eles Inteligência Artificial, Cloud, Ofertas SAS adequados a diversas expertises. Sob a minha responsabilidade ficou o tema SAS e Open Source –
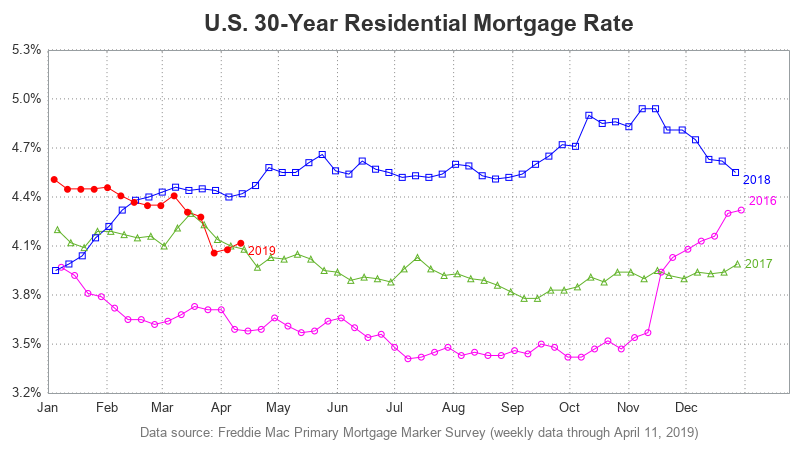
While we're on the topic of mortgage rates, let's explore another technique for plotting and comparing the rate data over several years. Last time, we plotted each year's data in a separate graph, and paneled them across the page. This time, let's overlay multiple years together in the same graph.


Imagine a world where satisfying human-computer dialogues exist. With the resurgence of interest in natural language processing (NLP) and understanding (NLU) – that day may not be far off. In order to provide more satisfying interactions with machines, researchers are designing smart systems that use artificial intelligence (AI) to develop


Phil Simon says that the downsides of even a few discrepancies can be enormous.


A few weeks ago, our team moved into SAS’ newest building, Building A. It’s a beauty, featuring a world-class training center, a bakery, and over 1000 pieces of artwork. While the abundance of baked goods is hard to beat, I think my favorite part about the building is the view.