
Adding tables and graphics on the same Microsoft Excel worksheet
By default, the ODS Excel destination adds a new worksheet for each table and graphic. However, at times, you might not want to use this default behavior. If you want more control over this, the SHEET_INTERVAL= ODS Excel option determines when a new worksheet is created. Valid values for the SHEET_INTERVAL= option include:
- TABLE (the default value) - new sheet for each table in output
- NONE - keep the output that follows on the current sheet
- PAGE - new sheet for each page of SAS output
- PROC - new sheet beginning at the PROC step boundary
- BYGROUP - new sheet for each BY group of output
- NOW - begin a new sheet immediately
The value NOW, new for SAS 9.4M5 (TS1M5), triggers the creation of a new worksheet after the destination encounters the next output object.
As an example of opting not to use the default behavior, consider a case where you have a CONTENTS procedure without any options. This procedure generates three separate worksheets with the data-set attributes, the engine host information, and the variable list.
The following table shows the default output that you receive with three individual worksheets:
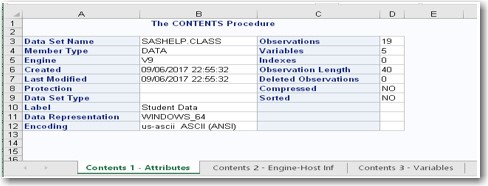
However, if you want to place all three objects on a single worksheet, you can do that by setting the option SHEET_INTERVAL="NONE". The option setting SHEET_INTERVAL="PROC" could also be used in this example which would create a new worksheet only when a new procedure is encountered.
The following example illustrates how to use this option to include all your output on the same worksheet:
ods excel file="c:\test.xlsx" options (sheet_interval="none"); proc contents data=sashelp.class; run; ods excel close; |
Output

Adding text and tables to a new worksheet
Two of the most popular ways to add text on worksheets are to use either the ODS TEXT= statement or the ODSTEXT procedure with the Excel destination. The following example adds text to a worksheet by using the ODS TEXT= statement. You include this statement before each PRINT procedure in this example:
ods excel file="c:\temp\test.xlsx"; ods excel options(sheet_name="Females"); ods text="Data for Female Patients"; proc print data=sashelp.class(where=(sex="F")); run; ods excel options(sheet_name="Males"); ods text="Data for Male Patients"; proc print data=sashelp.class(where=(sex="M")); run; ods excel close; |
Output
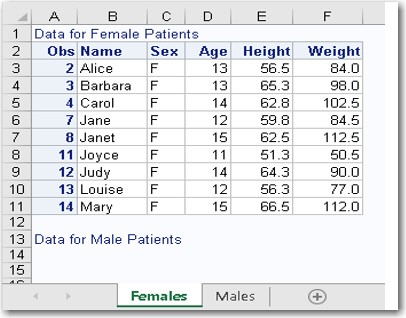
Notice that the first text string appears at the top of the first worksheet as expected. However, the text from the second ODS TEXT= statement appears at the bottom of this same page rather than at the top of the next worksheet containing the related data table. This behavior illustrates that the ODS TEXT= option is not very flexible. There is no good way to solve this issue.
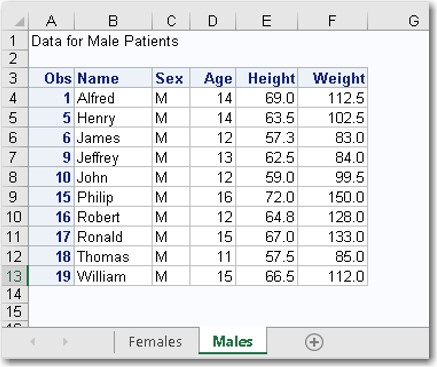
However, you can use the SAS 9.4 ODSTEXT procedure in combination with the SHEET_INTERVAL= option to move the text string to the appropriate worksheet.
The following example uses PROC ODSTEXT and the SHEET_INTERVAL= option to move the text string "Statistics for Male Patients" to the top of the second worksheet:
ods excel file="c:\temp\test.xlsx"; ods excel options(sheet_name="Females"); ods text="Data for Female Patients"; proc print data=sashelp.class(where=(sex="F")); run; ods excel options(sheet_name="Males" sheet_interval="now"); ods excel options(sheet_name="Males" sheet_interval="none"); proc odstext; p "Data for Male Patients"; run; proc print data=sashelp.class(where=(sex="M")); run; ods excel close; |
Output
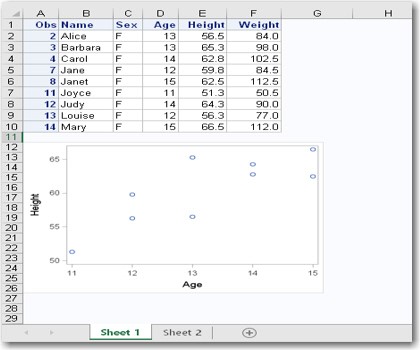
Adding multiple tables or graphs on the same worksheet
This final example demonstrates how you can use the SHEET_INTERVAL= option to add multiple tables and graphics to the same Excel worksheet. First, we use the SHEET_INTERVAL="NONE" option in the first ODS EXCEL statement to place the first table and graph on the same worksheet. Then, the SHEET_INTERVAL="NOW" option is included in the second ODS EXCEL statement option to create a second worksheet and write the second table and graph to that worksheet:
ods graphics / height=2.5in width=3.5in; ods excel file="c:\scratch\test.xlsx" options(sheet_interval="none"); proc print data=sashelp.class(where=(sex="F")); run; proc sgplot data=sashelp.class(where=(sex="F")); scatter x=age y=height; run; ods excel options(sheet_interval="now"); proc print data=sashelp.class(where=(sex="M")); run; proc sgplot data=sashelp.class(where=(sex="M")); scatter x=age y=height; run; ods excel close; |
Output
Learn more
- The ODS EXCEL destination (SAS documentation)
- Hemedinger, Chris. 2014. "Using ODS EXCEL and PROC EXPORT to bundle Excel-based reports." Accessed on April 18, 2019.
- Parker, Chevell. 2017. "Tips for Using the ODS Excel Destination." Accessed on April 18, 2019.

11 Comments
Hi Chevell,
Is there a way to put a table in a specific column and row in a sheet?
Hello Jeff,
There is the ability to position the first table on the worksheet using the ODS Excel option START_AT=. However, any tables that follow this table on the worksheet will follow within the same column. Please see the below example.
ods excel file="c:\temp\temp.xlsx" options(start_at="C2");
proc report data=sashelp.class;
run;
ods excel close;
The second example is missing an open parentheses after the OPTION keyword. I found this out after cutting and pasting the code. The other examples are correct.
This is the first example with SHEET_INTERVAL='NONE';
Hello Michael,
I hope you are doing well! Thanks for catching the syntax issue which I will correct as soon as possible. Thanks again!!
Sincerely,
Chevell
Hello,
Thank you so much for this resource. Do you know if there is a way to limit the tables that are produced in ODS Excel for a regression model? For example, for a logistic regression, is there a way to select to only see the table "Odds Ratio Estimates" and not the other tables such as "Type 3 Analysis of Effects"?
Hello Kelsey,
You have the ability to select or exclude the objects that you are interested in using the ODS SELECT/EXCLUDE statements. When I mention objects here, this is where raw data and template definitions are combined based on the procedure and options used with the procedure. The ODS TRACE statement is used to get the names of objects generated from the procedure such as the below. The trace records are added to the log and includes the object name which is shown in the partial list below.
ods trace on;
proc logistic data=Neuralgia;
class Treatment Sex;
model Pain=Treatment|Sex@2 Age Duration
/selection=forward expb;
run;
Output Added:
-------------
Name: ParameterEstimates
Label: Parameter Estimates
Template: Stat.Logistic.ParameterEstimates
Path: Logistic.ParameterEstimates
-------------
Output Added:
-------------
Name: OddsRatios
Label: Odds Ratios
Template: Stat.Logistic.OddsRatios
Path: Logistic.OddsRatios
-------------
Output Added:
-------------
Name: Association
Label: Association Statistics
Template: Stat.Logistic.Association
Path: Logistic.Association
-------------
You can use the object name on the ODS SELECT or Exclude statement to select only the objects you want included in the output or the objects you would like to see excluded.
In the below example, the ODS Exclude statement is used to exclude the "Oddsratio" object from the Excel output.
ods excel;
ods excel exclude oddsratio;
proc logistic data=Neuralgia;
class Treatment Sex;
model Pain=Treatment|Sex@2 Age Duration
/selection=forward expb;
run;
ods excel close;
Sincerely,
Chevell
Hello Kelsey,
To limit the tables that are produced with ODS Excel, you can use the ODS SELECT/ODS EXCLUDE statement with the output object that you want to either select or exclude. To determine the name of the output object that you are interested in, use the ODS TRACE statement and the trace record with the output object name will be added to the SAS log by default. You can then use this name on the ODS SELECT/ODS EXCLUDE statement to select or exclude output.
Sincerely,
Chevell
One more comment with respect to my last example in the previous comment. It would be possible to use the option embed_titles_once='yes' in that specific example.
However, if we want to keep several titles in the second worksheet, I'm not aware of a solution/workaround:
- one title for a first proc print and proc odstext
- one title for the second proc print and proc odstext.
ods excel file="c:\scratch\example2bis.xlsx";
ods excel options(embedded_titles='yes' sheet_name="Females" sheet_interval="none");
title 'Female 15';
proc print data=sashelp.class(where=(sex="F"));
run;
title;
proc odstext;
p "Data for Female Patients";
run;
ods excel options(sheet_name="Males" sheet_interval="now");
title 'Male (Age-Sex)';
proc print data=sashelp.class(where=(sex="M"));
var name age sex;
run;
title;
proc odstext;
p "Data for Male Patients (Age-Sex)";
run;
title 'Male (Height-Weight)';
proc print data=sashelp.class(where=(sex="M"));
var name height weight;
run;
title;
proc odstext;
p "Data for Male Patients (Height-Weight)";
run;
ods excel close;
EXAMPLE 1
"Notice that the first text string appears at the top of the first worksheet as expected. However, the text from the second ODS TEXT= statement appears at the bottom of this same page rather than at the top of the next worksheet containing the related data table. This behavior illustrates that the ODS TEXT= option is not very flexible. There is no good way to solve this issue."
If you look in the RESULTS tab, you will see a line before the proc print, indicating that the first ods text= statement belongs to another group.
But given that it not considered as OUTPUT (sheet_interval='output' by default), no distinct worksheet is created for this first statement.
EXAMPLE 2
For the second example, I would rather write :
ods excel file="c:\scratch\example2.xlsx";
ods excel options(sheet_name="Females" sheet_interval="none");
proc odstext;
p "Data for Female Patients";
run;
proc print data=sashelp.class(where=(sex="F"));
run;
ods excel options(sheet_name="Males" sheet_interval="now");
proc odstext;
p "Data for Male Patients";
run;
proc print data=sashelp.class(where=(sex="M"));
run;
ods excel close;
But bear in mind that if titles are used and proc odstext is after proc print, then the result won't exactly be as expected on the second worksheet.
ods excel file="c:\scratch\example2bis.xlsx";
ods excel options(embedded_titles='yes' sheet_name="Females" sheet_interval="none");
title 'Female';
proc print data=sashelp.class(where=(sex="F"));
run;
title;
proc odstext;
p "Data for Female Patients";
run;
ods excel options(sheet_name="Males" sheet_interval="now");
title 'Male';
proc print data=sashelp.class(where=(sex="M"));
run;
title;
proc odstext;
p "Data for Male Patients";
run;
ods excel close;
Is it possible to read a formula from Excel into SAS?
Example: Read this from an Excel cell:
=HYPERLINK("https://www.cms.gov/Medicare/Quality-Initiatives-Patient-Assessment-Instruments/Value-Based-Programs/SNF-VBP/Confidential-Feedback-Reporting-and-Review-and-Corrections-", "Confidential Feedback Reporting & Review and Corrections")