All Posts
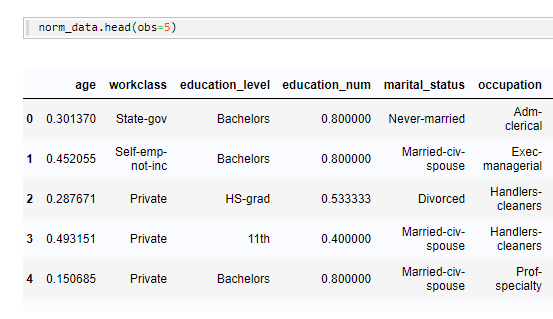

Parts 1 and 2 of this blog post discussed exploring and preparing your data using SASPy. To recap, Part 1 discussed how to explore data using the SASPy interface with Python. Part 2 continued with an explanation of how to prepare your data to use it with a machine-learning model.
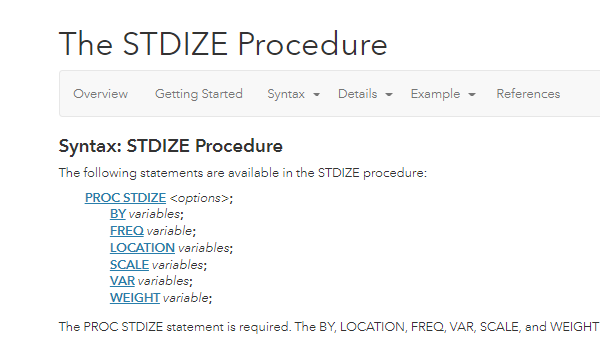
Bringing the power of SAS to your Python scripts can be a game changer. An easy way to do that is by using SASPy, a Python interface to SAS allowing Python developers to use SAS® procedures within Python. However, not all SAS procedures are included in the SASPy library. So,


I caught up with Ioannis Tsiliras, Director at OTE-COSMOTE, to discuss innovation, real-time and customer contact.


Jeff Stander helps us understand the different options of preparing data for analytics.


Who says that holidays have to be stuffed with belly-stuffing traditions? While the average American gains about one to two pounds between Thanksgiving and New Year’s Day, weight gain, indigestion and post-meal sluggishness do not have to be on your wish list.
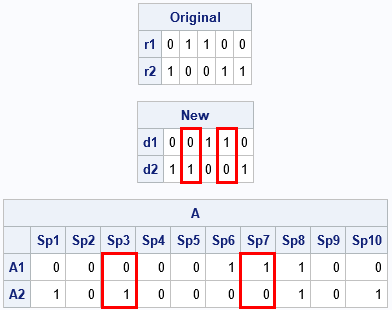

Binary matrices are used for many purposes. I have previously written about how to use binary matrices to visualize missing values in a data matrix. They are also used to indicate the co-occurrence of two events. In ecology, binary matrices are used to indicate which species of an animal are


For the last two months I’ve seen commercial after commercial with smiling faces, catchy tunes, and kids running around houses full of good food, presents, and family. This season, we’re encouraged to remember what “matters”. Here’s something else to remember: the goal of these commercials is for the company to


As we're getting into December, and the weather is getting colder, I thought it would be cool to plot some Antarctica data. You might remember I did this about 1.5 years ago, using good-old Proc Gmap, a special projection, and lots of tricky annotation. Well, this time let's use the


The DATA step remains a popular way to create and manipulate SAS data sets. Whether you are reshaping a data set entirely or simply assigning values to a new variable, there are numerous tips and tricks that you can use to save time and keystrokes.


A tecnologia moderna mudou a maneira como as marcas e os consumidores se conectam. Como será a experiência do cliente em 2030? De que forma vão as marcas evoluir para satisfazer as expectativas dos futuros consumidores? Estas são algumas das questões abordadas num estudo recente intitulado "Experience 2030: The Future
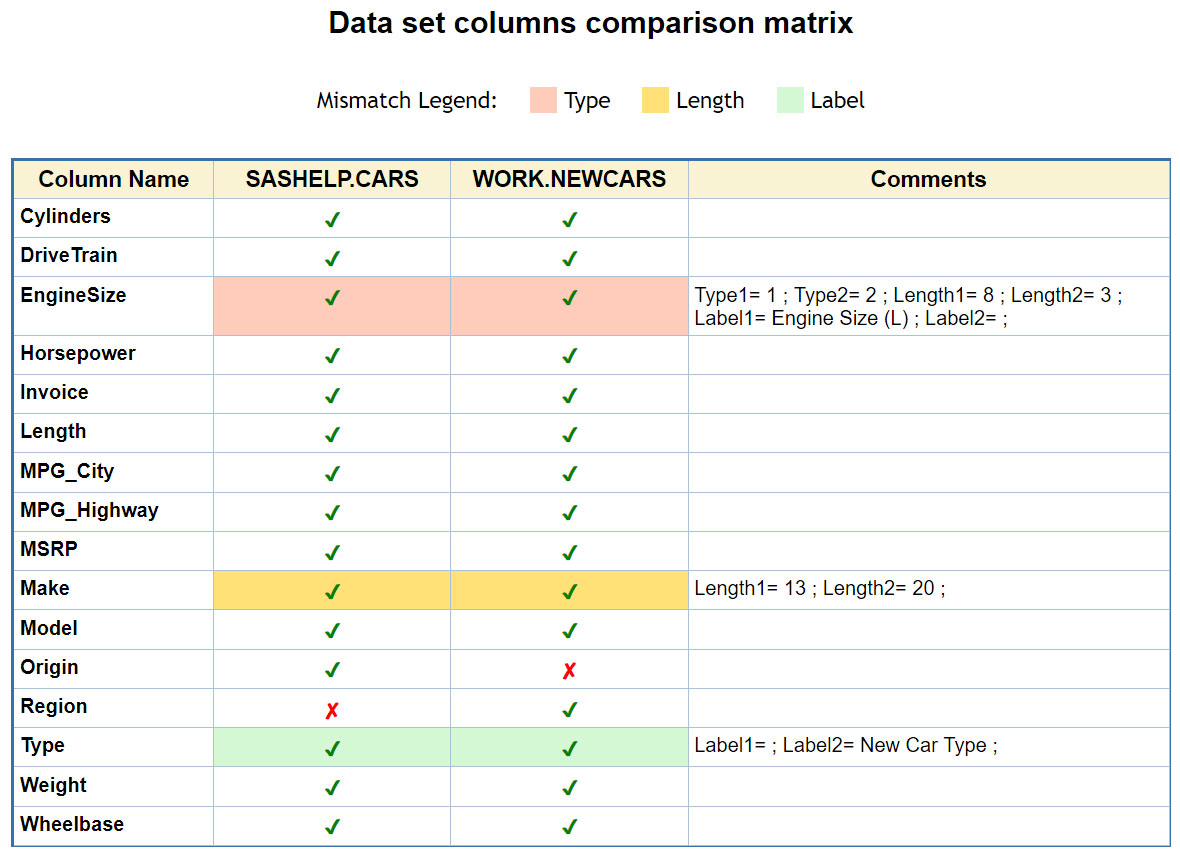

SAS' Leonid Batkhan shows you how to compare SAS data sets that include common and uncommon columns. You'll learn how to check mark commonalities and color-code differences in data tables side-by-side columns and add a comments field to see greater detail.
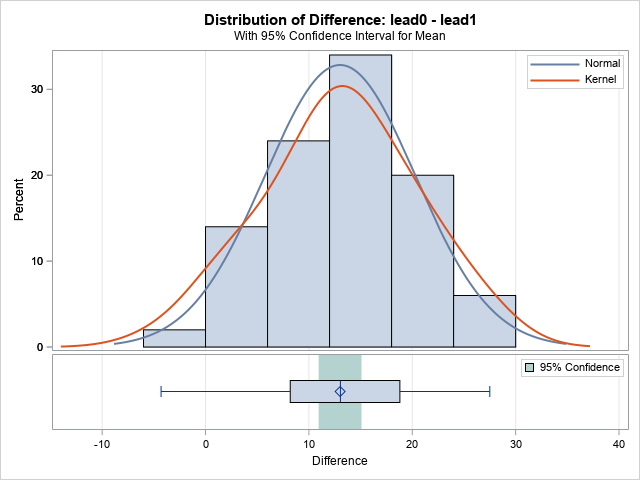
Recently I showed how to visualize and analyze longitudinal data in which subjects are measured at multiple time points. A very common situation is that the data are collected at two time points. For example, in medicine it is very common to measure some quantity (blood pressure, cholesterol, white-blood cell


Another year, another traditional Christmas song or carol turned into a fun technology-related version! This is the sixth year and my ninth song. I hope you enjoy your 2019 holiday song, based on this famous tune. The Data Science and AI Song Computer vision processing on an open stack The


One analysis suggests that in the first year of using process mining, the telecoms company had decreased its cost per process order by almost 40% and improved its productivity.
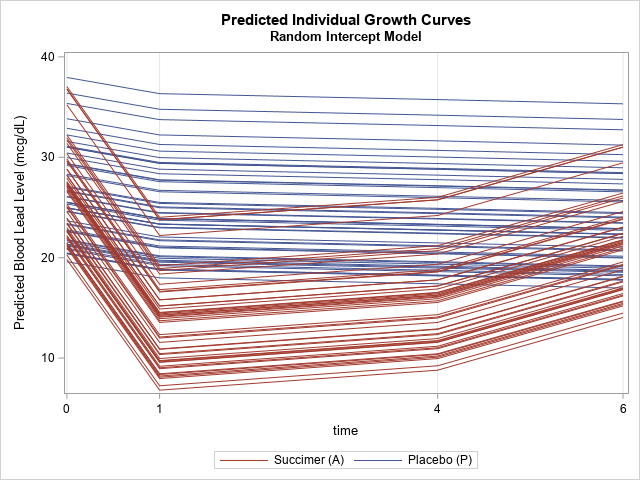
This is a second article about analyzing longitudinal data, which features measurements that are repeatedly taken on subjects at several points in time. The previous article discusses a response-profile analysis, which uses an ANOVA method to determine differences between the means of an experimental group and a placebo group. The