All Posts
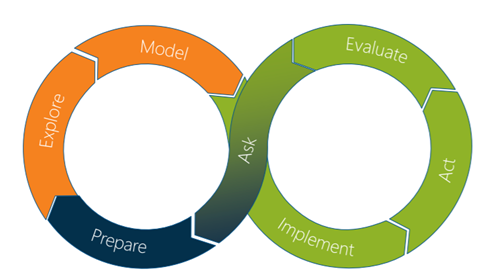

I believe the most important part of the analytics lifecycle is defining the business question being asked.

Most games of skill are transitive. If Player A wins against Player B and Player B wins against Player C, then you expect Player A to win against Player C, should they play. Because of this, you can rank the players: A > B > C Interestingly, not all games


How banks and government could work together to solve the UK’s burgeoning debt crisis


Recientemente, fueron publicados los resultados del Informe sobre el Futuro de los Empleos del Foro Económico Mundial, el cual no solo traza el mapa de lo que serán los empleos y las habilidades del futuro, sino que tiene en consideración el impacto que producirá en la forma de trabajar en la


In football, five out of the 11 players on offense are on the field to accomplish one goal: keep the defenders as far away from the ball as possible. Sometimes it’s more than five. Teams will bring extra linemen on short-play packages. Tight ends and full backs might check in


We kunnen er niet meer omheen, data en analytics zijn overal aanwezig in ons dagelijks leven. In organisaties groot en klein wordt de behoefte om eindelijk eens iets met de data te gaan doen alsmaar sterker. We kunnen zo enkele vraagstukken in onze samenleving opnoemen die we met data en


SAS' Sandy Gibbs kicks off a series of posts on hot fixes for SAS®9 environments.


It’s been a few years since I read Priya Parker’s The Art of Gathering, but it continues to inspire me to think about purposefulness in relation to gathering. A good gathering, a good friendship, a good relationship; all are going to be the product of mindful and purposeful effort. As


La décima edición del Buen Fin, el evento comercial más importante en México, será relativamente distinta a las de años anteriores: la pandemia por COVID-19 y el cierre de las tiendas físicas durante una larga temporada aceleraron la digitalización de los retailers en la carrera por brindar a los consumidores


What comes to mind when you think of a “homeless person”? Chances are, you’ll picture an adult, probably male, dirty, likely with some health conditions, including a mental illness. Few of us would immediately recall homeless individuals as family members, neighbors, co-workers and other loved ones. Fewer still are likely aware of how many youths (both minors and young adults) experience homelessness annually. Homeless youth is a population who can


It’s no surprise that nonprofit organizations providing health-related services are overconsumed during the COVID-19 pandemic, but what about other types of nonprofits? According to CNM President and CEO, Tina Weinfurther, the pandemic has affected nonprofits in different ways. Some are running on fumes, while others have doubled in size and
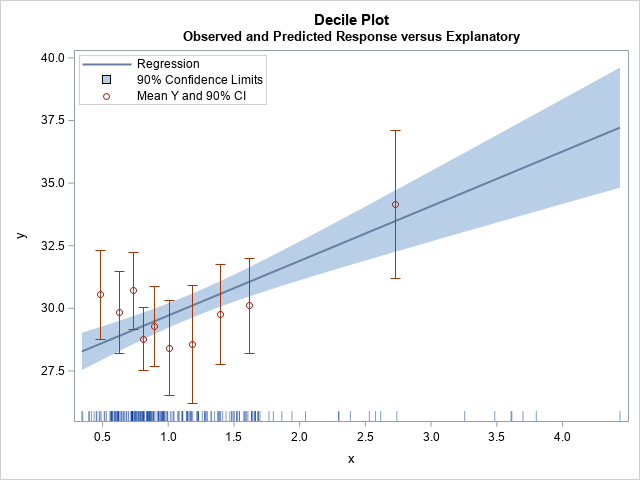
I previously showed how to create a decile calibration plot for a logistic regression model in SAS. A decile calibration plot (or "decile plot," for short) is used in some fields to visualize agreement between the data and a regression model. It can be used to diagnose an incorrectly specified


Most New Yorkers like to fantasize about owning and living in a classic New York City brownstone, complete with high ceilings, large windows and a front stoop. You can picture yourself sitting there alongside the iron railing with a cup of coffee while you watch the city wake up and


Il comportamento di acquisto dei consumatori è andato incontro a numerosi cambiamenti durante e a seguito del lockdown. E questo non ci sorprende, visto l'impatto che il Covid-19 sta avendo sulla nostra vita quotidiana. La vera domanda che dobbiamo porci è: questi cambiamenti sono solo momentanei? La soddisfazione di ogni

The following is an excerpt from Cautionary Tales in Designed Experiments by David Salsburg. This book is available to download for free from SAS Press. The book aims to explain statistical design of experiments (DOE) to readers with minimal mathematical knowledge and skills. In this excerpt, you will learn about