All Posts
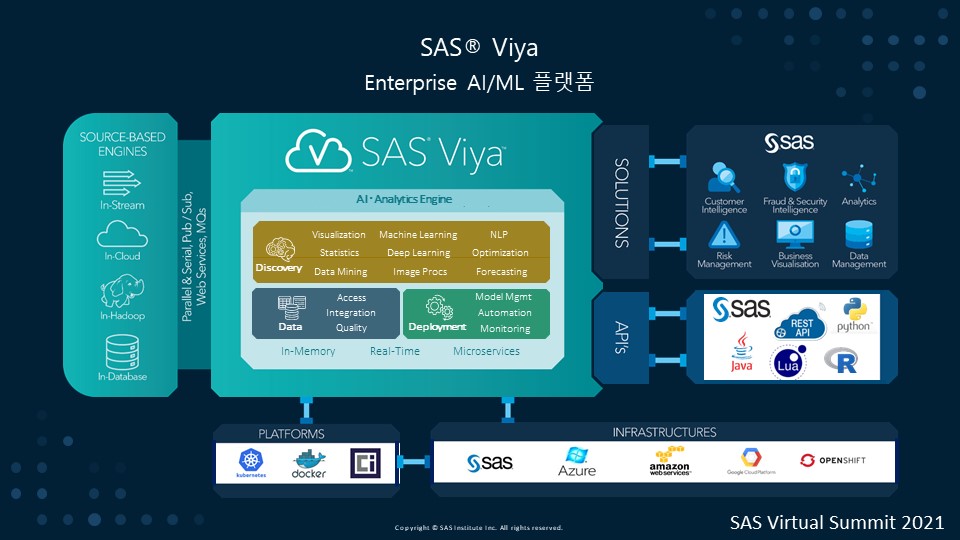

분석은 왜, 전사적으로 활용되지 못할까요? 최근 맥킨지 연구에 따르면 AI와 분석을 전 세계 산업 전반에 적용할 경우, 약 9조~15조 달러의 가치 창출이 가능합니다. 그런데도 오직 8%의 주요 기업만이 전사적으로 분석을 활용하고 있습니다. 무려 90% 이상의 기업이 분석을 조직의 모든 영역으로 확산하지 못하고 있는 것입니다. 조직 내 분석 확산과 관련하여 주요 관계자들은 각기 다른 고민을 안고 있습니다. ▶IT리더는 제한된 비용으로 신기술을 적용하고 혁신을 이루어야 합니다. 한편으로는 끊임없이 개발 및 변경되는 분석 모델을


Wirtschaftsministerin Baden-Württemberg, Dr. Nicole Hoffmeister-Kraut, im Gespräch.


Ready to turn big data into big business insights? Look to the cloud.


At SAS, curiosity is at the heart of who we are and what we do. It’s one of our core values, and what drives us forward every day. It’s been this way since the beginning, and our rich history of curiosity has paved the way for some unique aspects of


With the SAS Visual Data Science Decisioning (VDSD) trial, you get the ultimate analytics experience with free access to all SAS Viya analytic capabilities for 14 days. SAS Visual Data Science Decisioning provides the ultimate experience covering the entire analytics lifecycle – from managing data, developing models, and deploying models to take decisions.


Mental health and data sharing. Seeing those phrases in a single sentence gives even the most seasoned professionals pause. This is legitimately sensitive data. And there are often specialized confidentiality and privacy laws due to the stigma and discrimination against those with mental health disorders. All the same, many agencies are starting to ask


El texto no estructurado es la mayor fuente de datos generada por el ser humano y crece exponencialmente cada minuto. No hay que olvidar que la tecnología está ya presente en todos los aspectos de nuestras vidas, tanto profesionales como personales, y nos permite conversar rápidamente a través de textos,


Nut butters are a secret weapon for making fruits, raw veggies and oatmeal more satisfying. If you’ve branched out beyond peanut butter, you know store-bought nut and seed butters can get expensive and often contain added sugar and oils, so why not make your own? If you have some nuts,
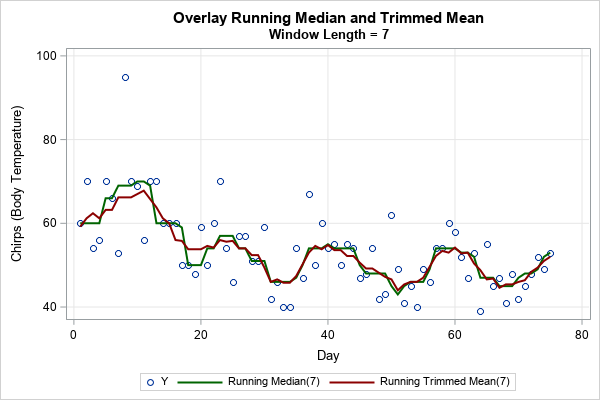

When data contain outliers, medians estimate the center of the data better than means do. In general, robust estimates of location and sale are preferred over classical moment-based estimates when the data contain outliers or are from a heavy-tailed distribution. Thus, instead of using the mean and standard deviation of


Most computers can execute operations in parallel due to their multicore infrastructure. Performing more than one operation simultaneously has the potential to speed up most tasks and has many practical uses within the field of data science. SAS Viya offers several products that facilitate parallel task execution. Many of these

In SAS Studio, the ordering of rows and columns in the Table Analysis task are, by default, arranged by the internal ordering of the values used in the table. The table arranges the variables alphabetically or numerically by increasing value. For example, traditional coding uses 1 for Yes and 0


In the US we are seeing rapid changes related to COVID-19 cases, the ending of mask requirements and messages of “a return to normal”. I want to be sensitive to the fact that not all parts of the US or the world are seeing improvements and in some places the


In her Ted Talk, Gavriella Schuster, Corporate Vice President of Commerical Partner Team at Microsoft, shares that in 1991, 36% of the computing workforce in the United States was women. In 2020, that number fell to 25%. We're going in the wrong direction of gender equity in high tech.
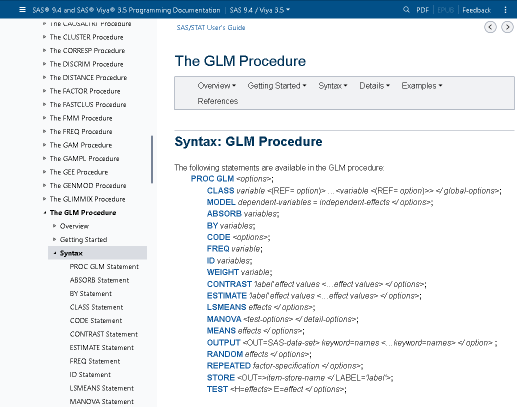
I refer to the SAS documentation every day. Usually, I want information about SAS syntax and the statistical formulas and algorithms for various options and statements. Although I have bookmarked common documentation books and chapters, sometimes it is easier to perform an internet search to find information. I've discovered a


El sector bancario está viviendo una profunda renovación a causa de distintos factores. En primer lugar, se enfrenta a la revolución tecnológica que está afectado a todas las organizaciones y áreas de actividad a nivel global. Pero, además, está notando los efectos de un cambio en el sistema financiero que