All Posts
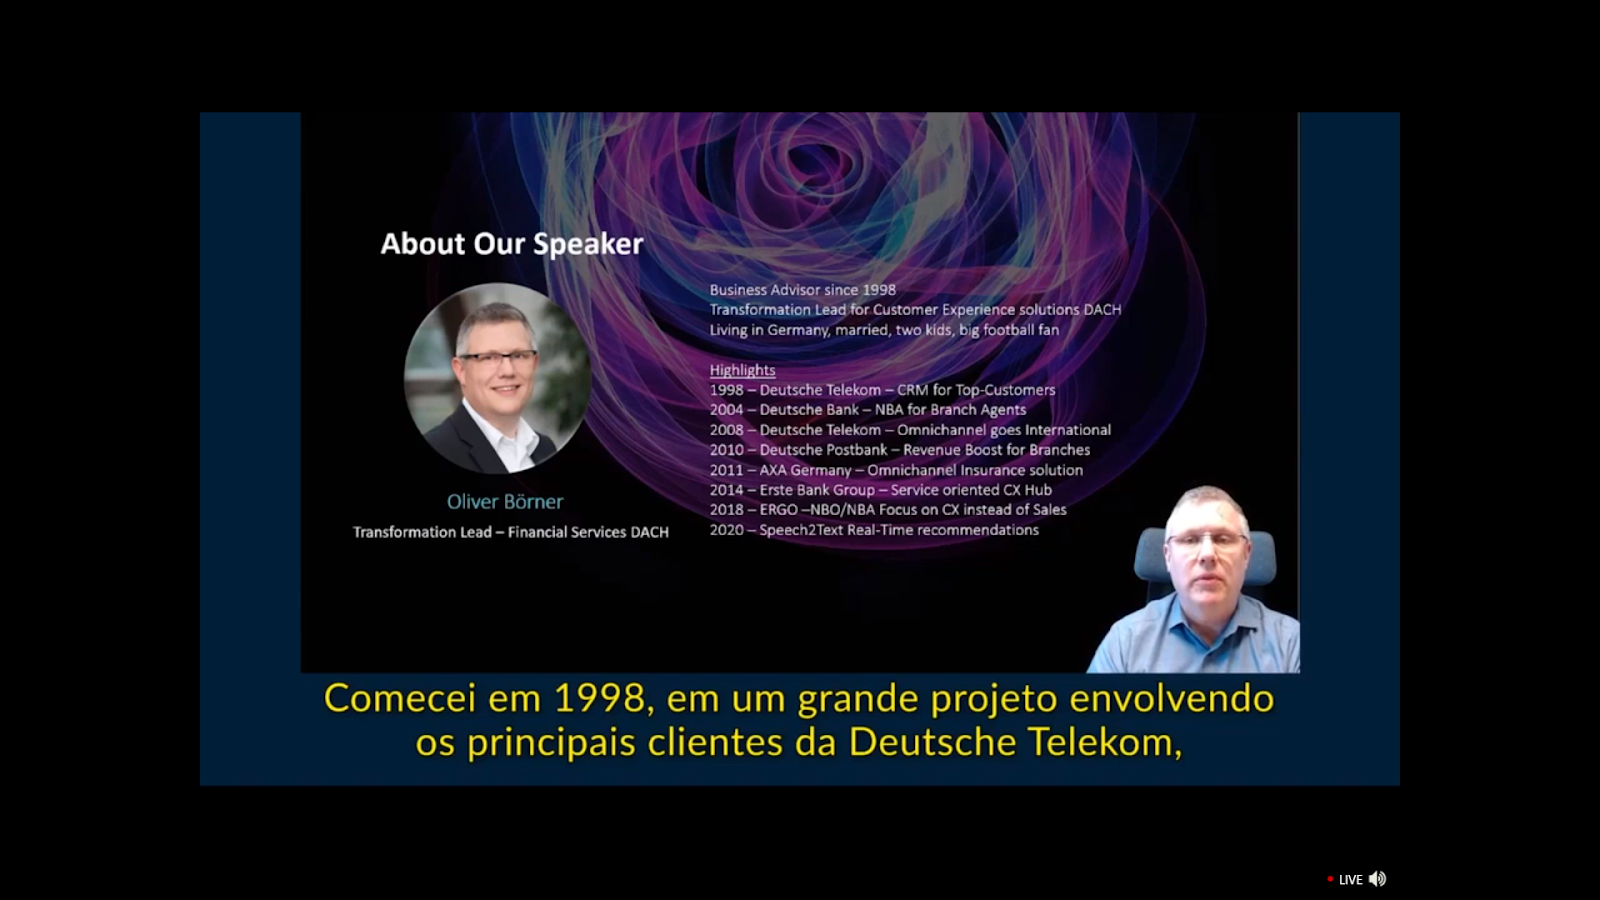

Durante o Insurance Summit Brazil 2021, Oliver Börner fala sobre a importância de se ter uma visão 360º do cliente e equilibrar a melhor experiência à rentabilidade da empresa “Customer Experience é como um casamento. Escutar é melhor que falar”. Com esta frase, Oliver Borner, líder de Customer Intelligence para
Considerando a inovação e transformação digital que atinge o setor de seguros nos últimos tempos, Fabio Mittelsteaedt, líder da indústria de serviços financeiros na Microsoft Brasil, foi um dos convidados do Insurance Summit 2021 para debater sobre o tema. A principal necessidade das seguradoras, segundo o executivo, é a maior


Eduardo Polidoro, diretor de negócios de IoT da Claro, falou sobre o potencial da internet das coisas na digitalização dos negócios e o impacto no setor de seguros Keynote speaker da primeira edição do SAS Insurance Summit, Eduardo Polidoro, diretor de negócios de IoT da Claro, abordou em sua palestra

Em palestra no Insurance Summit 2021, Agustin Terrile, consultor especializado em seguros do SAS, mostrou um pouco das mudanças do IFRS17 do ponto de vista da estimativa de fluxos de caixa e demonstrou as etapas para um modelo acurado e ágil. Terille começou falando sobre o motor de cálculo e

Na palestra “Agent Gaming no setor de Seguros”, Kim Kuster, consultora de negócios em Inteligência de Segurança do SAS, explicou o que é agent gaming e como a prática impacta na área de seguros. Além disso, mostrou alguns casos de sucesso no combate a esse tipo de fraude e fez


El sector minorista es uno de los nichos más ha resentido el impacto de la actual pandemia. La escasez de ciertas líneas de productos, el confinamiento, la interrupción de las cadenas de suministro y el cierre de tiendas físicas provocaron que los consumidores modificaran la manera en que compran, la
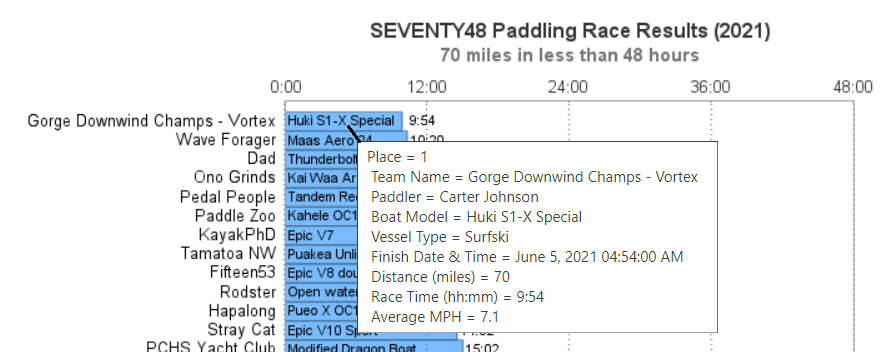

I've got this buddy, Carter Johnson - he's a little bit crazy, but a lot of fun to follow... He holds/held several different long-distance paddling world records, and was one of the coaches for the group that paddled kayaks from Cuba to the US (see my blog post). A few

Cast your ballots for the SAS Support Communities, nominated for the Khoros Kudos Award: Best-in-Class: Community.


Depression and anxiety are the two most common mental health issues in the U.S. Over the past decade or so, more and more research is linking these common issues with lifestyle habits, meaning that what we eat and how much we move, sleep, play and stress out can affect our

포스트 코로나 시대의 불확실한 미래를 헤쳐나가기 위해서는 그 어느 때보다 예측력을 높여야 합니다. 예측 알고리즘을 사용하면 불확실성을 최소화하고, 정책이나 전략에 따른 변화를 보다 정확히 가늠하며 최적의 의사결정을 내릴 수 있습니다. SAS Visual Forecasting이 필요한 이유 Forecasting 알고리즘은 어떻게 미래를 변화시킬 수 있을까요? ARIMA와 같은 전통적인 단변량 시계열 알고리즘은 타깃(종속) 변수만을
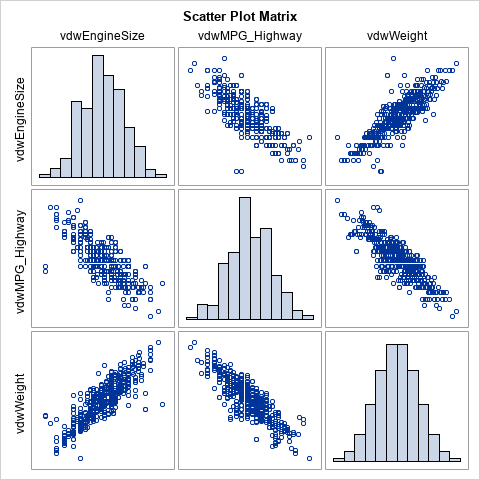

Many nonparametric statistical methods use the ranks of observations to compute distribution-free statistics. In SAS, two procedures that use ranks are PROC NPAR1WAY and PROC CORR. Whereas the SPEARMAN option in PROC CORR (which computes rank correlation) uses only the "raw" tied ranks, PROC NPAR1WAY uses transformations of the ranks,

성공을 위한 3가지 필수 요소 시장조사기관인 IDC는 올해, 제조 분야에서 디지털 트랜스포메이션에 가장 많은 투자가 이뤄질 것으로 전망합니다. 구체적으로 디스크리트 제조 2,250억 달러, 프로세스 제조 1,250억 달러, 총 3500달러의 투자를 예상합니다. 디지털 트랜스포메이션을 성공적으로 수행하기 위해서는 3가지 요소가 필요합니다. ▶첫째, 사람. 모든 혁신의 주체는 사람입니다. 사람의 능력, 조직구조, 문화가 상당히


Un usuario entra al portal de un banco para solicitar una disposición de efectivo importante que puede hacer a través de su tarjeta de crédito. Después de una verificación automática, se determina que el cliente tiene un buen historial de compra y solicitudes de retiro de dinero, las cuales ha
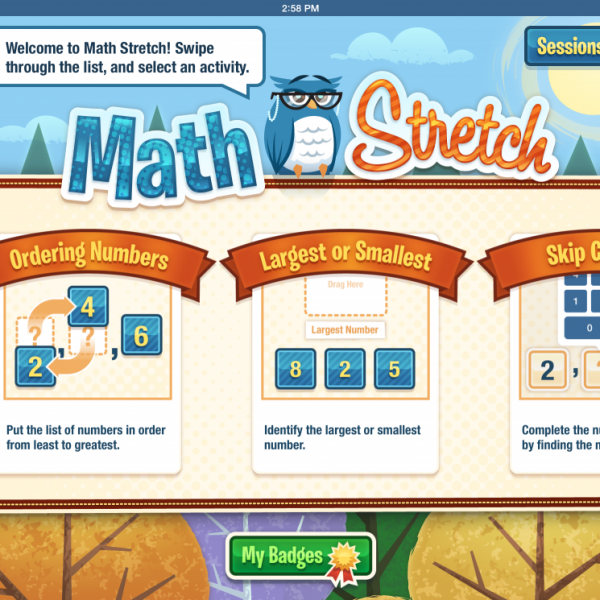

Looking for ways to combat pandemic fatigue or summer slide? Would you like resources to boost your child's confidence and competency? Or do you need a backseat activity on your family’s next road trip? SAS® Math Stretch is the answer. It's a free iPad app that captivates early learners while
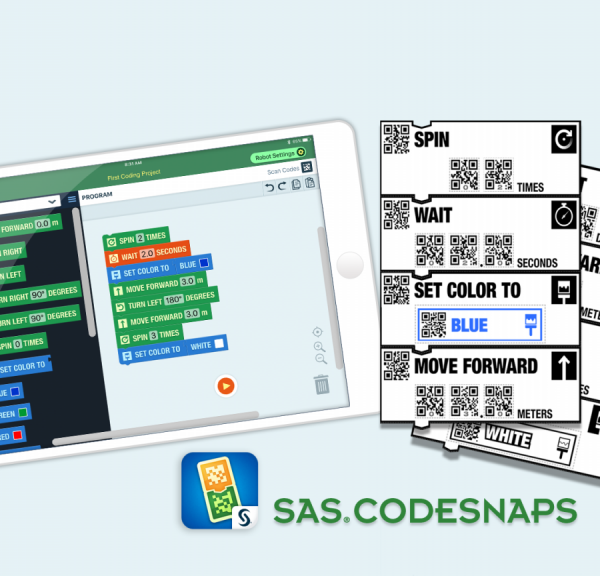
SAS® CodeSnaps is an easy, affordable, and engaging tool. All you need is one iPad, the free CodeSnaps app, one Sphero robot, and a problem to solve. Students work collaboratively in teams to generate the code required to move the Sphero; they build a program using the printable coding blocks, scan it with the app, and execute the program to check their logic. CodeSnaps is accessible and appropriate for all learners across all disciplines. Get creative and challenge your students to navigate an obstacle course, find members of a word family, explore the digestive system, or travel the Oregon Trail. Your imagination is your only limitation.