All Posts


SAS' Kelly Fellingham, an advanced analytics software developer, reveals how SAS software's new SASEBEA interface helps you identify patterns in US economics data.
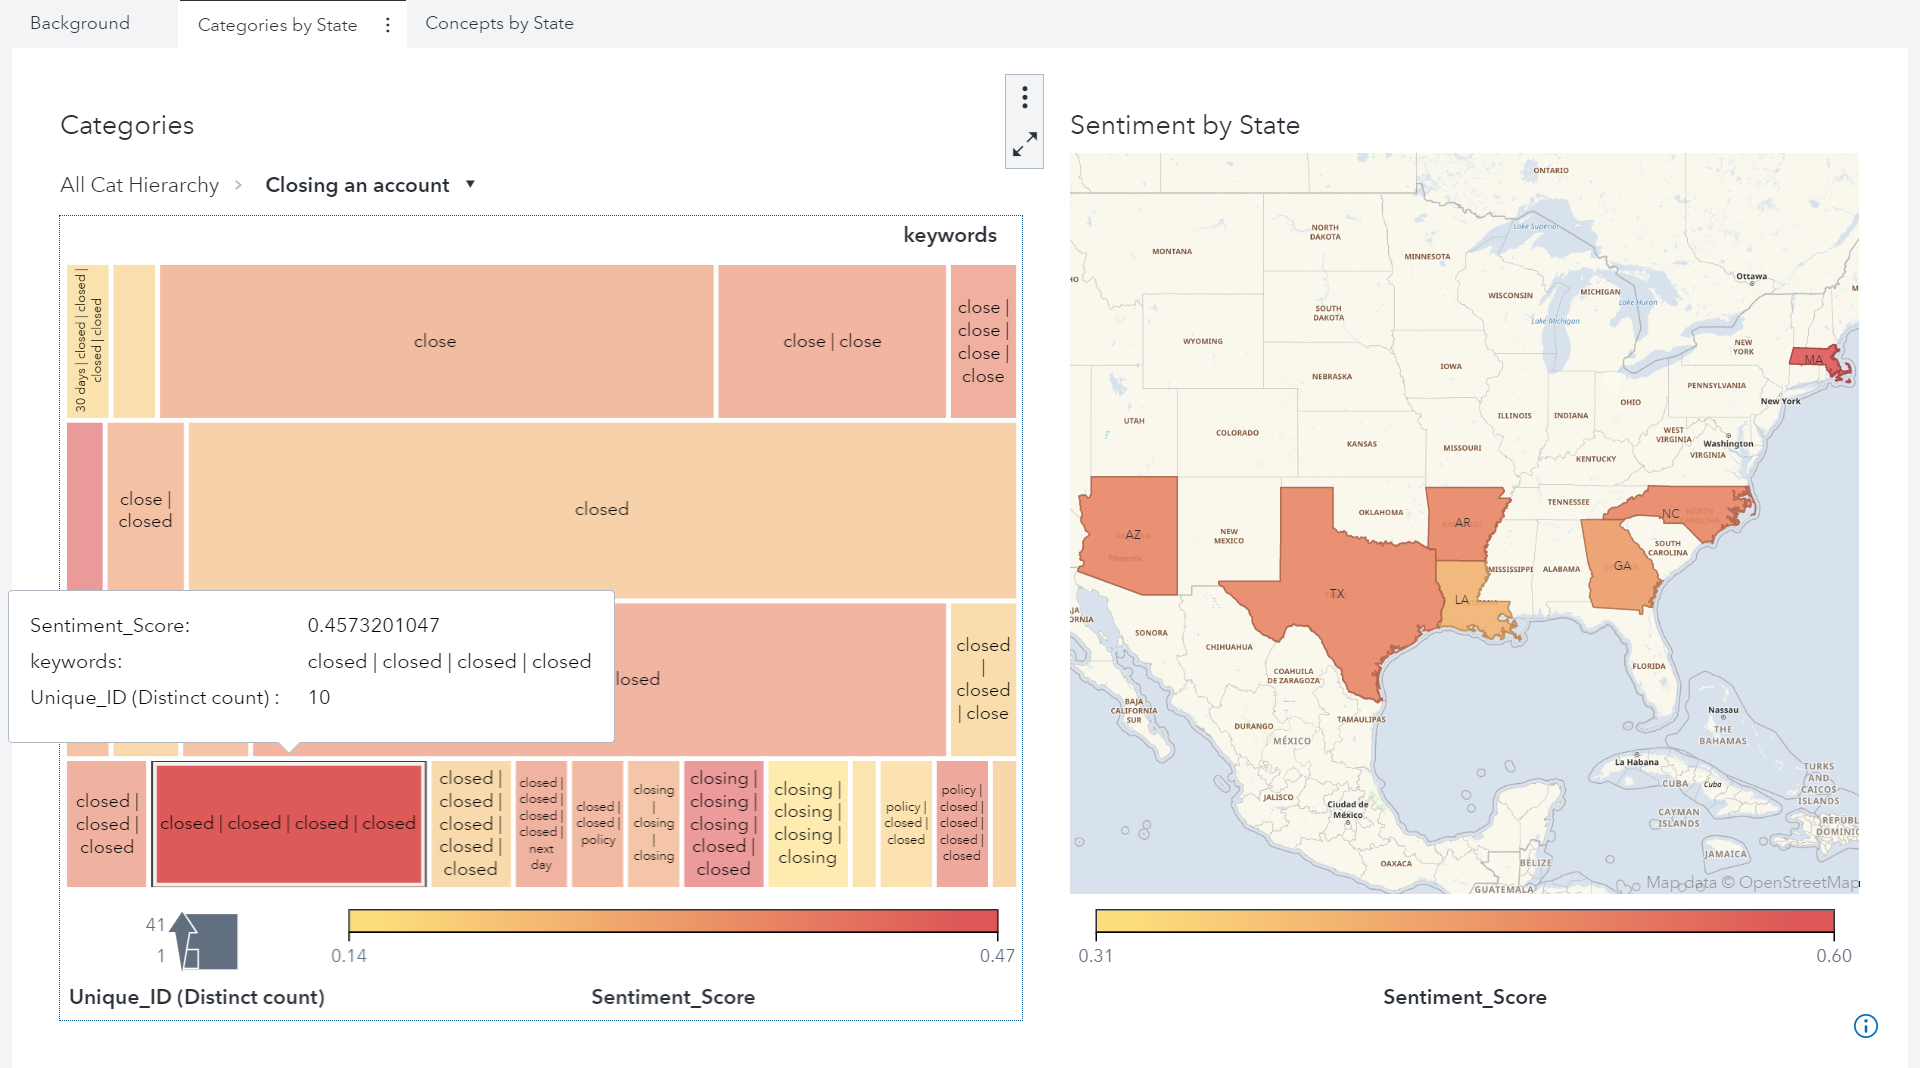

It is increasingly possible to use text analytics to explore different types of data. When a news story this summer caught my eye, I decided to see if I could use SAS Visual Text Analytics (VTA) and SAS Visual Analytics (VA) on customer complaints to provide information that might be


This is a post from a few years back, pre-COVID. It seems particularly timely as many of us may now be planning a visit to see older adults in our family that we have been separated from due to the pandemic. As the holidays approach, one of the highlights

지불/결제(Payments) 사기는 악의를 가진 누군가가 다른 사람의 개인 결제 정보를 훔치거나 속여 빼낸 다음 해당 정보로 허위 또는 불법 거래에 사용할 때 발생합니다. 새로운 결제 수단이나 서비스가 인기를 끌 때마다 결제 환경과 트렌드가 바뀝니다. 사기범들도 마찬가지입니다. 그들은 새롭고 점점 더 교묘해지는 지불/결제 사기 수법을 개발하여 새로운 환경에 적응합니다. 사기범은 사기를


The relationship between insurance companies and their clients has always been tricky due to several factors. But just like any other sector today, insurance organizations are transforming with digital technologies – and these solutions are customer-centric. What’s in store for customer relationships in the insurance industry? Keep on reading to


Introduction In an era of high connectivity and instant gratification, the expectations of customer experience have never been higher. Customers do not simply want but rather expect accessible and responsive communication across a variety of channels. And for organisations, the risks have never been higher. Disgruntled users now have the


We are getting used to seeing banks considering climate risk. After all, it is closely related to other types of risks that financial institutions mitigate and manage. There are two main types of risks associated with climate: Physical risk of financial losses directly related to climate change-related extreme weather events. Transition


Skąd się wzięła i czym jest analiza śledcza, zwana także analizą kryminalną? Potrzeba stworzenia takiego narzędzia zaistniała w końcu lat 60-ch w USA i została wyartykułowana przez organy ścigania. Była ona spowodowana rozwojem przestępczości zorganizowanej, dużą liczebnością i skomplikowaną strukturą grup przestępczych oraz transgranicznym charakterem przestępstw, w czym przodowała włoska
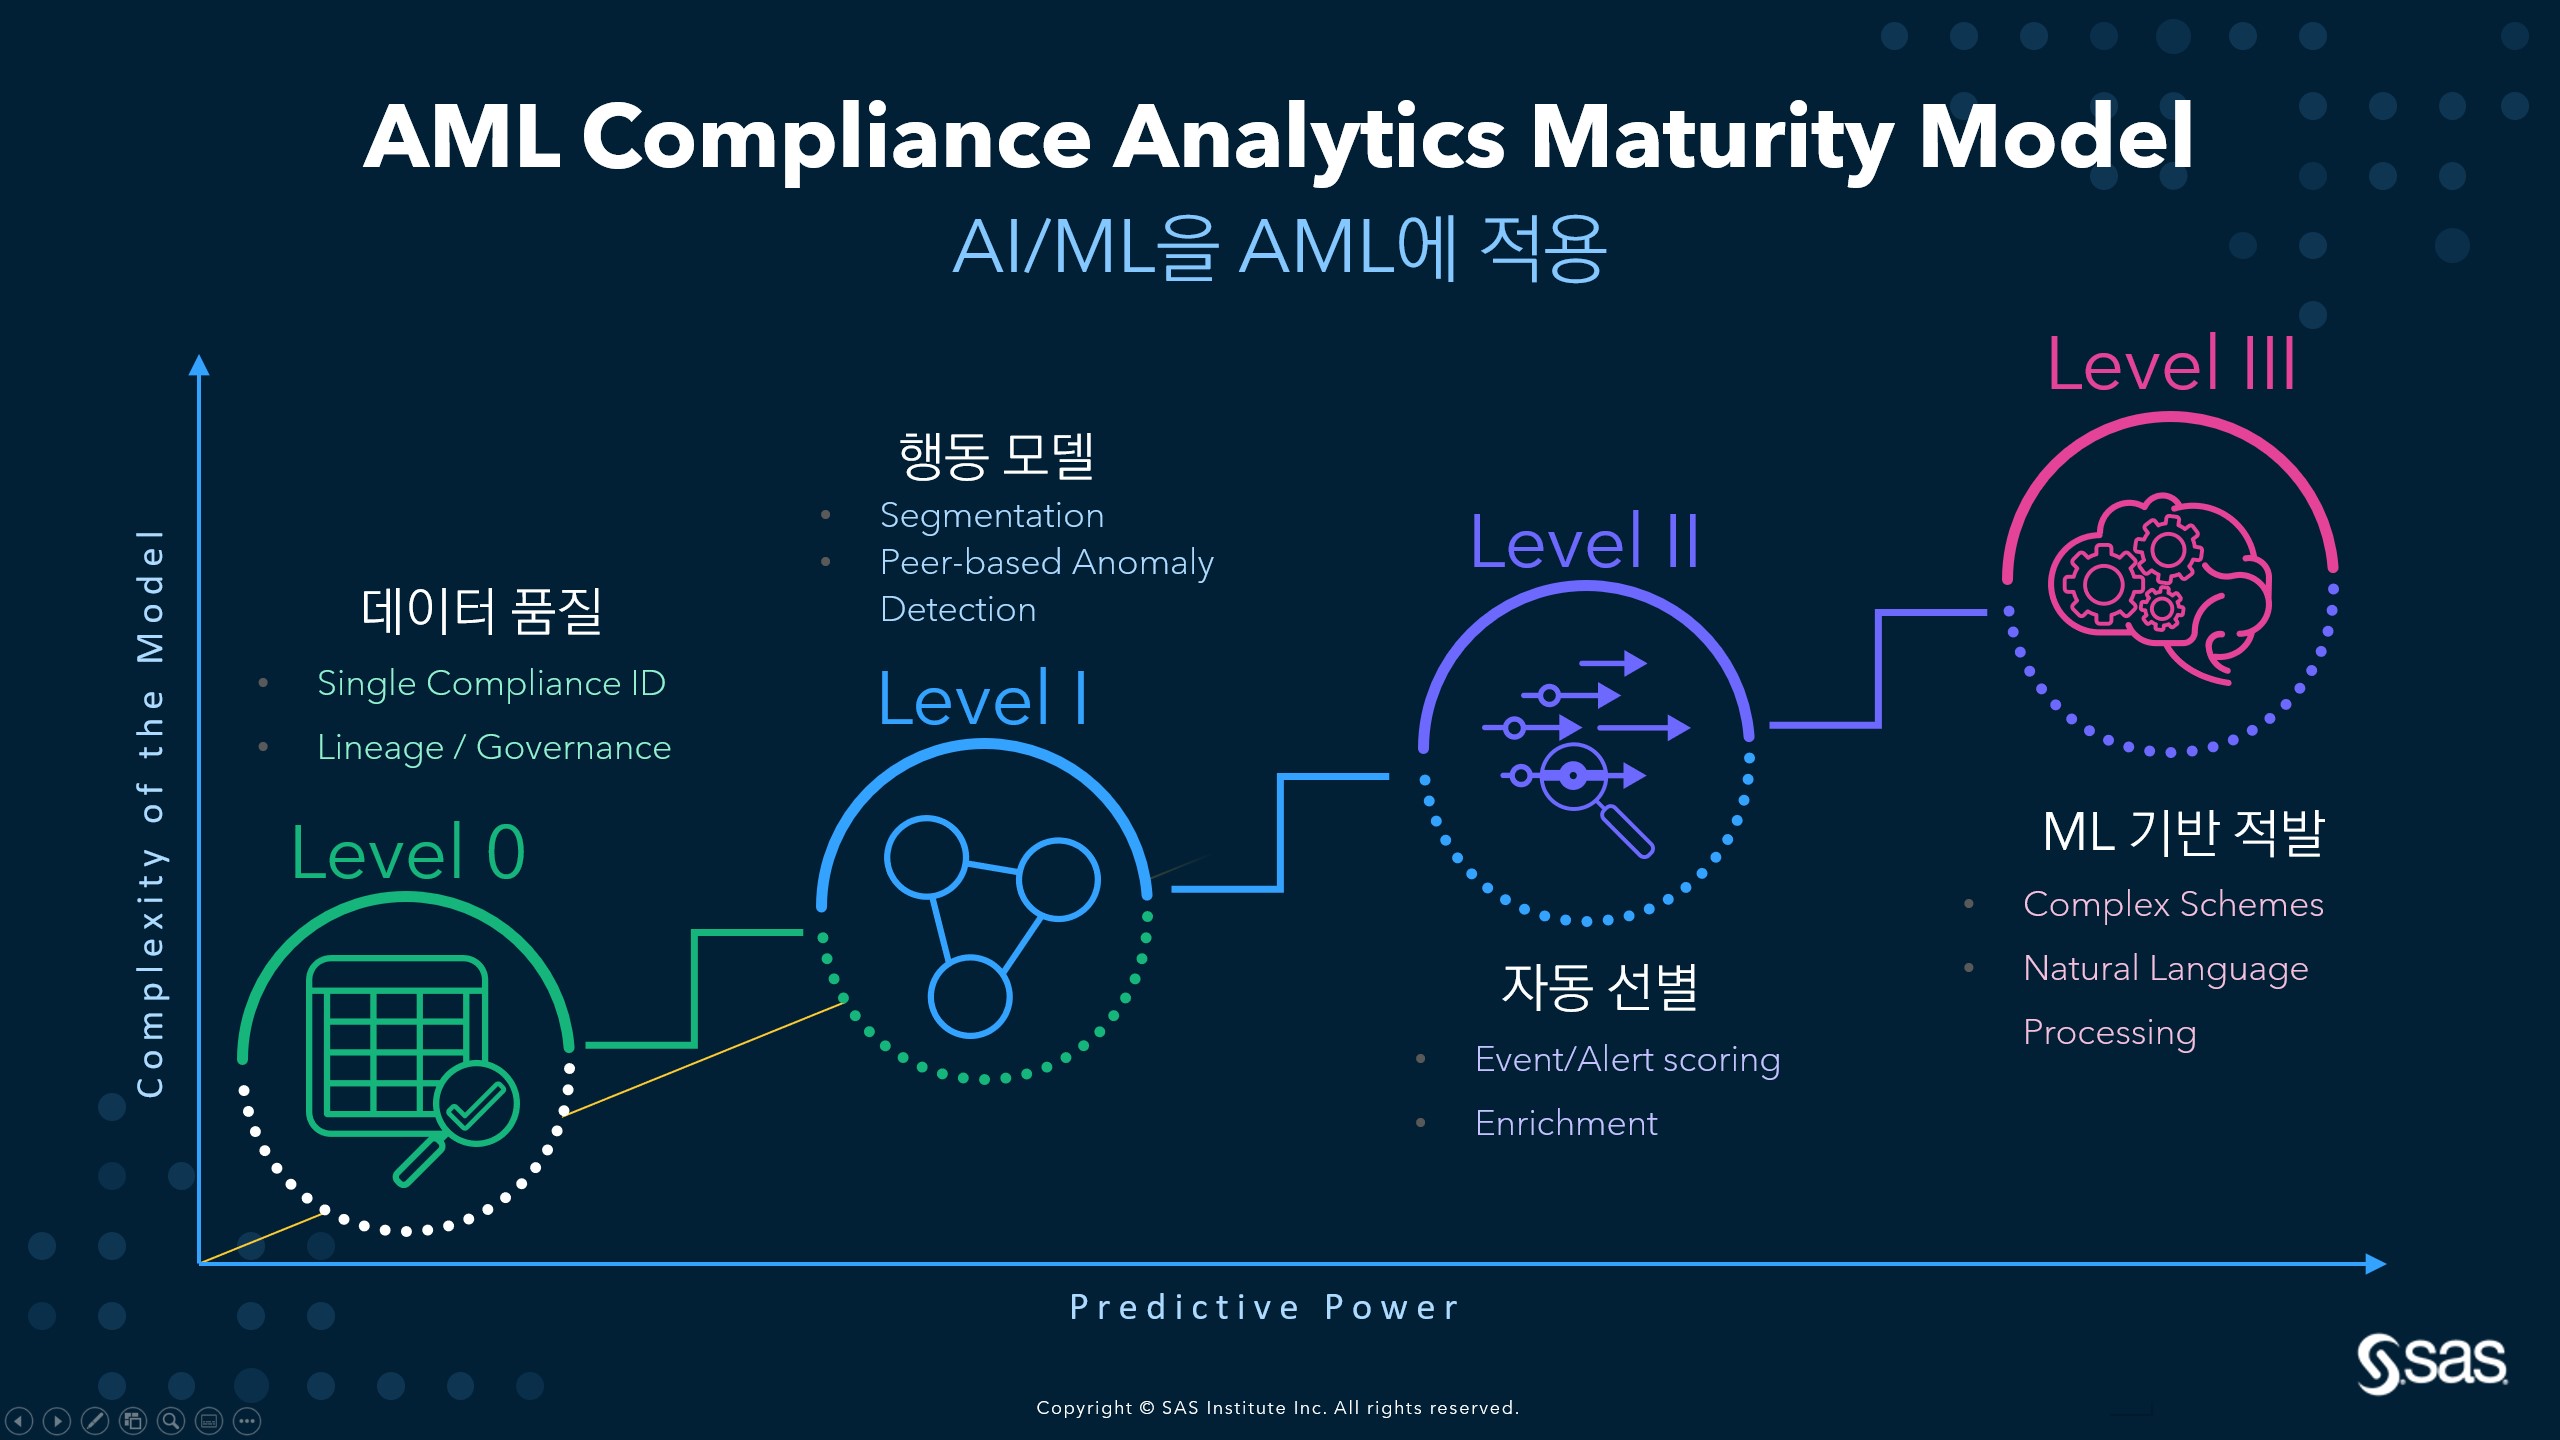

1회. 도입 목적과 범위, AML Compliance Analytics Maturity Model 자금세탁 방지 의무가 있는 대부분의 금융 기관과 기업은 자금세탁 방지와 관련된 컴플라이언스 업무 수행을 위해 막대한 인력, 시간, 비용, 노력을 투자하고 있습니다. 자금 세탁 방지 컴플라이언스는 FATF가 설립된 1989년 이후 자금세탁 방지(AML;Anti-Money Laundering), 테러자금조달 방지(CFT; Countering the Financing of Terrorism), 대량살상무기

Because it is near the end of the year, I thought a blog about "Summarizing" data might be in order. For these examples, I am going to use a simulated data set called Drug_Study, containing some categorical and numerical variables. For those interested readers, the SAS code that I used


There is growing awareness and discussion about the need to remodel business processes in banks. This is partly in response to the disruption caused by the pandemic, partly because of macroeconomic pressures such as changing interest rates, and partly a way to address changing customer behavior and expectations. This last


La acelerada digitalización de los servicios y el cambio definitivo en el comportamiento de los clientes son algunas de las razones que llevarán a las empresas a aumentar sus inversiones en tecnología en el 2022. Aunque la tecnología no lo es todo en los procesos de transformación digital, sí es


La analítica, la inteligencia artificial, el machine learning y todas las nuevas ciencias encaminadas a aprovechar mejor los millones de datos que hay en la actualidad tienen un gran impacto en el mundo -y lo tendrán aún más- en la medida en que incidan directamente en el progreso de la


As we come to the end of the year when gift giving is popular, there is nothing kinder than making something special for family, friends and loved ones. It’s a double win because many products on the shelves today contain chemicals or harmful substances that our bodies are unfamiliar with


The 2021 SAS Hackathon was a major success and teams are now signing up for the 2022 hackathon. We are inviting you to join us. The world has lots of problems in search of answers and it’s your chance to contribute some creative solutions. Here’s what the team from KPMG