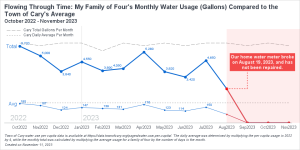
Have you ever been curious about your monthly water consumption and how it compares to others in your community? Recently, I had this question and decided to get ahold of my family's water usage data for analysis. Harnessing the power of data visualization, I compared my family of four's monthly
Tag: SGPLOT procedure
Amazing things can be created when you start with small pieces and stack them together. Just ask Bryan Berg. He is the current world record holder for the tallest house of cards. This same principle can be applied to the SGPLOT and SGPANEL procedures. You can take the individual plot
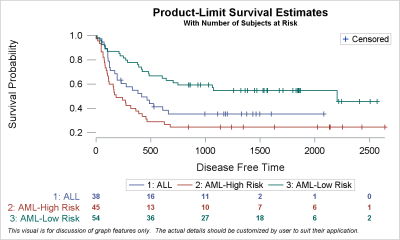
Survival plots are automatically created by the LIFETEST procedure. These graphs are most often customized to fit the needs of SAS users. One way to create the customized survival plot is to save the generated data from the LIFETEST procedure, and then use the SGPLOT procedure to create your custom
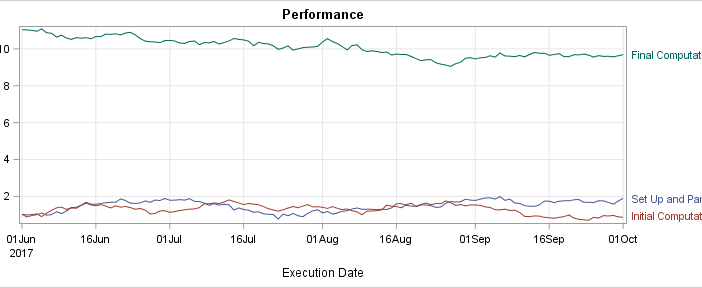
Curve labels in series plots can be positioned inside or outside the graph. Date variables can be specified as TYPE=LINEAR with a date format or more commonly as TYPE=DATE. Sometimes external curve labels might appear below or above the graph, particularly with TYPE=DATE axes. This post shows you ways to move them to the right of the graph.
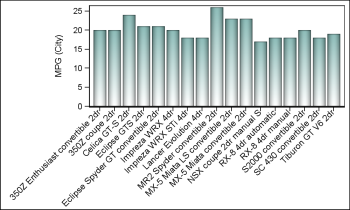
Fitting of long category values on a x-axis is usually a challenge. With SAS 9.4, the SGPLOT procedure tries to fit the values by first splitting the values at white space to see if the values will fit in the space available. This normally works well for a small number
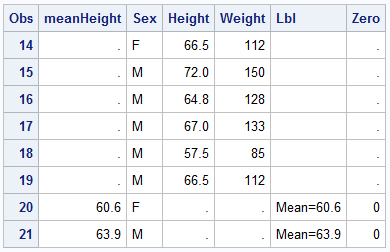
Last week a user asked about BY variable group processing for SGAnnotate with SGPLOT procedure. The user provided a simple use case for the question (always a good idea) using the sashelp.class data set. The graph included a display of reference lines for the mean value of height using annotation. The
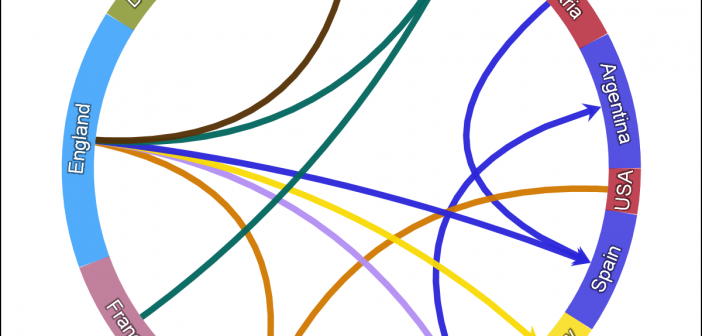
One request came in for the previous article on Circle link graph, for the addition of arrow heads to indicate the direction of the flow. Given that I am using a SERIES plot to render the links, it is relatively easy to add arrow heads to the links as the SERIES
Last week I had the pleasure of presenting my paper "Graphs are Easy with SAS 9.4" at the Boston SAS Users Group meeting. The turn out was large and over 75% of the audience appeared to be using SAS 9.4 back home. This was good as my paper was focused on the cool new
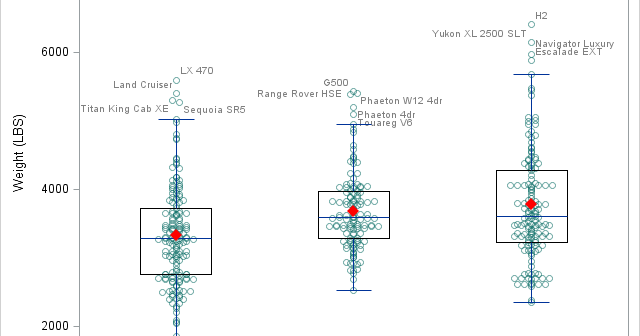
There was a recent comment on the original 'Unbox Your Box Plots', where a user wants to see the original data for the box, but only label the outliers. As noted in the comment, labeling all the scatter markers and turning on the outlier display is not ideal. But there
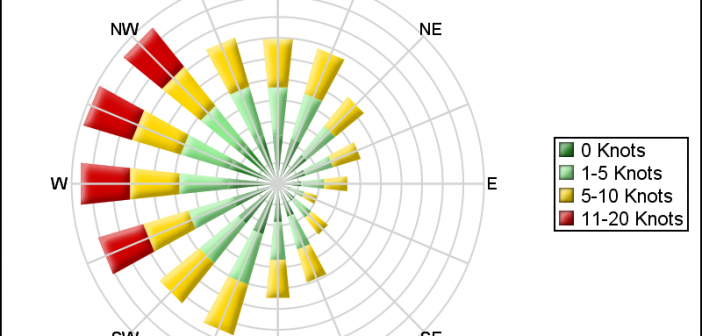
Last week I posted an article on displaying polar graph using SAS. When the measured data (R, Theta) are in the polar coordinates as radius and angle, then this data can be easily transformed into the XY space using the simple transform shown below. x=r*cos(theta * PI / 180); y=r*sin(theta * PI