Last week a user asked about BY variable group processing for SGAnnotate with SGPLOT procedure. The user provided a simple use case for the question (always a good idea) using the sashelp.class data set. The graph included a display of reference lines for the mean value of height using annotation. The problem was that all the lines defined were being rendered in each graph and were not getting filtered with the BY group as SGAnnotation does not support BY variable processing. See the graph in the linked question above.
This is a good example of a user who is familiar with SAS/GRAPH programming using SGPLOT. When you do that, it is useful to remember that SGPLOT supports many plot statements that can be "Layered" together to create a graph. With SGPLOT, graphs should preferably be built by adding plot layers as far as possible. This will work for a large number of graphs and annotation may be needed only for a few cases.
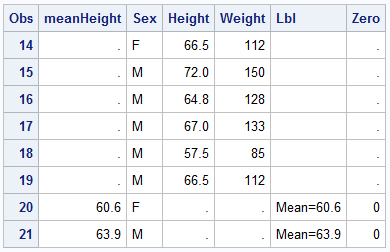 This use case is actually better handled in SGPLOT by using plot layers. Instead of building a separate data set of the mean values by sex for the annotated reference lines, we can merge that data into the single data set. We compute the mean values by sex using the MEANS procedure and then we can merge the computed data into the original data set (by Sex). The last few rows of the final data set are shown on the right. The data set is a merge of the relevant columns of sashelp.class and the computed mean values by sex. I have also added a column called LBL for the label that I want to display on the mean reference line at x=zero.
Now, in addition to the SCATTER statement, we can use a REFLINE statement layer to display the reference lines at the mean value, and also label the line as necessary using a TEXT plot. The active BY variable for the procedure will automatically work with the reference line and text plot to render the desired results. The data set is sorted by sex for BY variable processing.
SGPLOT code:
title 'Height by Weight';
proc sgplot data=class2 uniform=yscale noautolegend;
by sex;
scatter x=weight y=height;
refline meanHeight;
text x=zero y=meanHeight text=lbl / position=topright ;
run;
 The graph on the right is one of the two graphs generated for By value of Sex=F. The reference line is displayed at the appropriate value, along with the label "Mean=60.8" positioned at the left end of the reference line. If your SAS release does not include support for TEXT plot, you can leave it out, or use SCATTER with MarkerChar option.
Note the use of the procedure option UNIFORM=yscale which makes the y-axis data range uniform across all the graphs. Click on the graph for a higher resolution view.
There are multiple benefits of using plot layers instead of annotation.
- Each plot contributes its data range and offset requirements to the axes.
- The axes union the data ranges, and communicate the information back to the plots for display.
- The plots can be interspersed between other plots in the order we want.
- The plots contribute to legends (and work with attribute maps).
- The data also works correctly with the BY variable.
While not significant here, plot ordering and group attribute assignment and contribution to legends can be a big benefit in other graphs such as the Swimmer Plot. So, when coming to SGPLOT from SAS/GRAPH, it will be to your benefit if you don't just duplicate the process you use with GPLOT and annotate. There may be other ways to achieve the right results.
Full SAS9.40 code: layers


1 Comment
Pingback: Mixing plots with different classification - Graphically Speaking