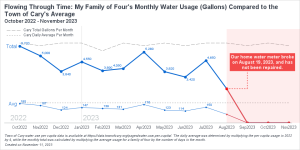
Have you ever been curious about your monthly water consumption and how it compares to others in your community? Recently, I had this question and decided to get ahold of my family's water usage data for analysis. Harnessing the power of data visualization, I compared my family of four's monthly
Tag: SGPLOT
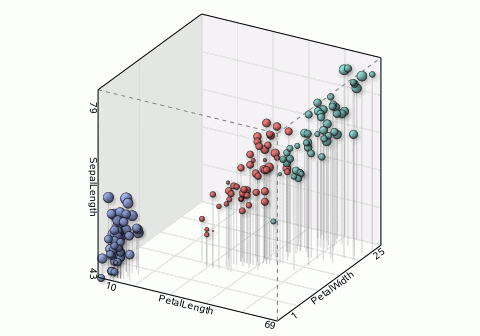
SAS SGPLOT already provides the necessary graphical elements for complex visualization. 3D or high-dimensional data can be easily visualized after being projected appropriately. With SAS' strong support for animation features, SAS users can create complicated 3D or high dimension visualizations quickly.
Amazing things can be created when you start with small pieces and stack them together. Just ask Bryan Berg. He is the current world record holder for the tallest house of cards. This same principle can be applied to the SGPLOT and SGPANEL procedures. You can take the individual plot
A scatter plot is my go-to graph! It's what I often start with to get a feel for the data ... and I often end up using just a scatter plot. But some scatter plots are better than others ... In this blog post, I create a scatter plot of
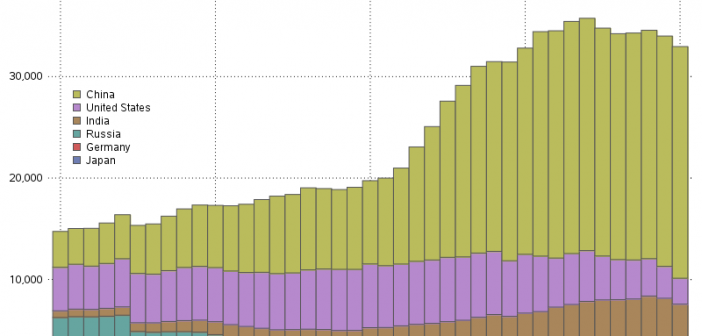
These days, many countries are moving away from coal, and towards natural gas, hydro, wind, and solar as ways to meet their electricity needs. I had heard that some countries still use a lot of coal (especially those countries with large coal deposits), and I was curious which countries use
Recently, the news has been all abuzz about William Shatner traveling into space. This was a cool event because he's the oldest person who has traveled into space (at 90 years old) ... and he was also the iconic Captain Kirk from the original Star Trek television series. This got
The rumors are true - The Graph Guy is retiring! I've been working at SAS for about 30 years, and had lots of fun stretching the limits of SAS' graphing & mapping software over the years. But I've decided to retire while I'm still young enough to pursue a lot
Many cities have Open Data pages. But once you download the data, what can you do with it? This is my sixth in a series of blog posts where I download public data about Cary, NC, and demonstrate how you might analyze that type of data (for Cary, or any
Many cities have Open Data pages. But once you download the data, what can you do with it? This is my fourth in a series of blog posts where I download public data about Cary, NC, and demonstrate how you might analyze that type of data (for Cary, or any
Many cities have Open Data pages. But once you download the data, what can you do with it? This is my third in a series of blog posts where I download several datasets from Cary, NC's open data page, and give you a few ideas to get you started on