Recently, the news has been all abuzz about William Shatner traveling into space. This was a cool event because he's the oldest person who has traveled into space (at 90 years old) ... and he was also the iconic Captain Kirk from the original Star Trek television series.
This got me wondering how many other people have traveled into space, and when ... therefore I decided to dig up the data, and create a graph!
The Data
As with many lists like this, I was able to find the data on Wikipedia. But it was in a fancy table format, with some of the table cells (such as date of flight) being sized to encompass several astronaut rows, etc. This makes it difficult to read in the table programmatically (even when using Rick Langston's clever code for reading tables from web pages).
But using Rick's code, along with some clever "data stepping" I was able to eventually get the data into a clean SAS table.
The SAS Code
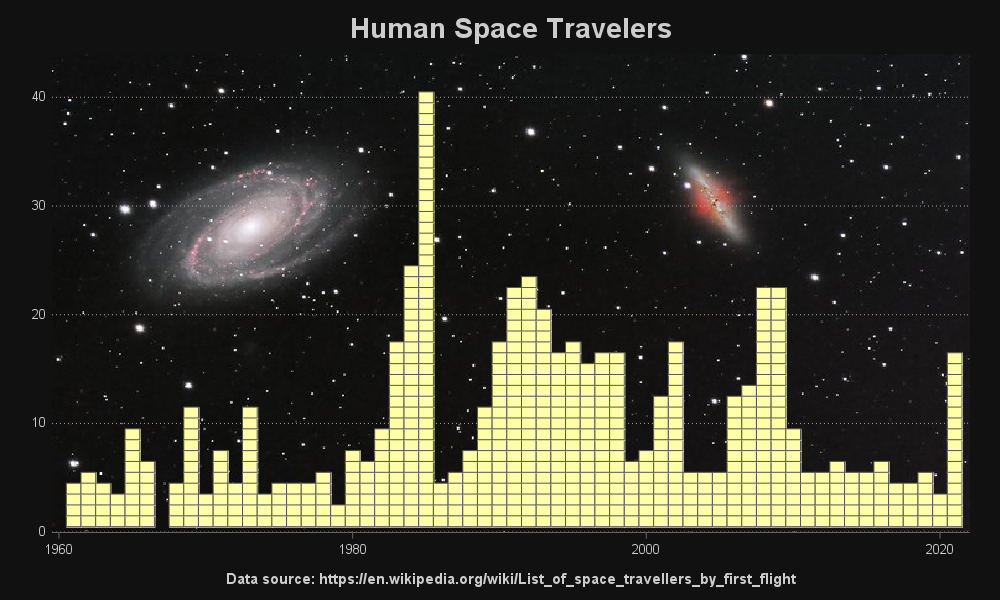
I wanted to create a bar chart, with the height of each bar representing how many astronauts flew into space that year. But ... I also wanted to make it a stacked bar chart, where each astronaut was represented by a separate segment in the bar (so each segment could have a separate mouse-over text with the astronaut's name, etc). There are probably multiple ways of doing that - but instead of using a bar chart, I used (or some might say misused) a 'heat map'. I suppose as long as it comes out looking the way I want, it doesn't matter whether that's the kind of chart the proc was intended to produce, eh!?!
Anyway, here's the main part of the code I used to draw the heat map, so that it looks like a stacked bar chart:
data anno_image;
function='image'; layer='back'; height=100; width=100; drawspace='WallPercent';
image='galaxies2.jpg';
run;
proc sgplot data=my_data nowall noborder noautolegend
pad=(left=5pct right=5pct) sganno=anno_image;
styleattrs datacolors=(cxFFFFAA);
heatmapparm x=year y=count_y colorgroup=groupvar /
outline outlineattrs=(color=gray55)
tip=(name country ship date) url=my_html;
yaxis display=(nolabel noticks noline)
grid gridattrs=(pattern=dot color=grayaa)
offsetmin=0 offsetmax=0;
xaxis display=(nolabel);
run;
The Graph
Here's a png image of the graph - you can click it to see the interactive version, with HTML mouse-over text, and drilldowns (each drilldown launches a Google image search for the astronaut you clicked). The background image is one that my buddy John (mentioned in my retirement blog) captured with his astrophotography gear - it shows Bode's Galaxy (M81) and Cigar Galaxy (M82).
Who's next to go into space!?!


2 Comments
Rob,
I would be interested in the full code. Could you post the link?
Thanks,
Brian
Here's the main code (minus the macro that read in the table)...
https://sascommunities.github.io/graphics-programming/robert/space_travelers.sas