포스트 코로나 시대의 불확실한 미래를 헤쳐나가기 위해서는 그 어느 때보다 예측력을 높여야 합니다. 예측 알고리즘을 사용하면 불확실성을 최소화하고, 정책이나 전략에 따른 변화를 보다 정확히 가늠하며 최적의 의사결정을 내릴 수 있습니다.

SAS Visual Forecasting이 필요한 이유
Forecasting 알고리즘은 어떻게 미래를 변화시킬 수 있을까요? ARIMA와 같은 전통적인 단변량 시계열 알고리즘은 타깃(종속) 변수만을 가지고 예측하는 모델로, 내외부 영향 요인에 따른 타깃의 영향도와 변화의 정도를 파악할 수 없습니다. 반면 SAS의 Visual Forecasting은 영향 요인별 영향도 및 변화를 파악할 수 있는 다양한 알고리즘을 제공합니다.
SAS Visual Forecasting은 예측 프로세스를 간소화 및 자동화합니다. 데이터 사이언티스트나 비즈니스 사용자는 GUI 환경에서 예측 모델링과 What-If 시뮬레이션을 손쉽게 수행하고, 이를 기반으로 의사결정권자는 최선의 의사결정을 할 수 있습니다.
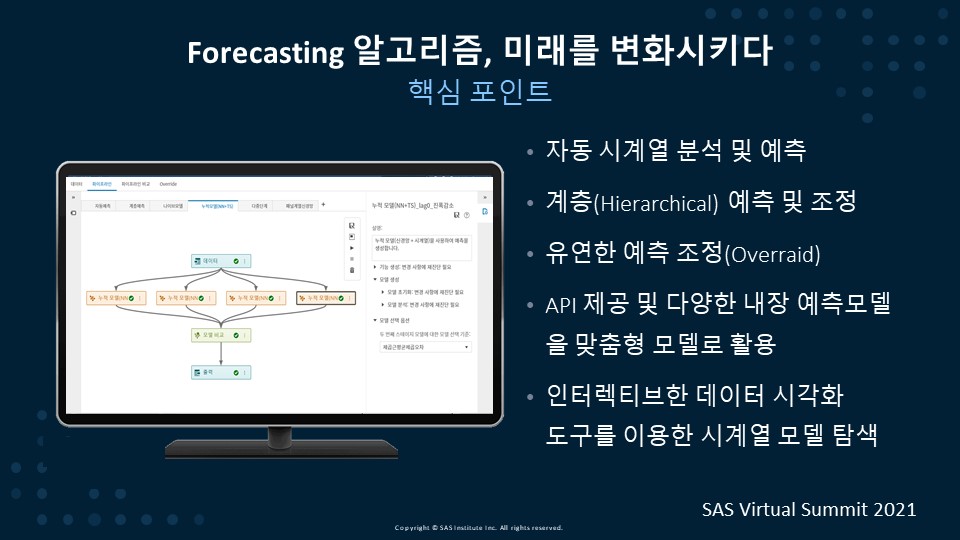
주요 기능은 다음과 같습니다.
▶자동 시계열 분석 및 예측. 다량의 시계열 자료를 자동으로 분석하고 예측합니다.
▶계층(Hierarchical) 예측 및 조정. 다량의 시계열이 계층 구조를 가지는 경우, 계층 예측을 수행하고 계층 레벨에 따른 조정 기능을 제공하므로 최하위의 예측치 합이 최상의 예측치 합과 일치할 수 있는 일관성을 제공합니다.
▶유연한 예측 조정. 통계적으로 예측된 예측 결과를 사용자가 유연하게 조정할 수 있는 조정(Override) 기능을 제공합니다.
▶API 제공 및 다양한 내장 예측 모델 활용. 내장된 다양한 탬플릿을 사용하여 사용자가 맞춤형 모델로 활용할 수 있습니다.
▶사용자 대화식의 인터랙티브한 데이터 시각화 도구를 이용한 시계열 모델 탐색. 손쉽게 모델링한 예측 결과를 데이터 탐색 및 시각화 도구인 SAS Visual Analytics를 이용하여 인터랙티브한 리포트를 구성할 수 있습니다.
적용 사례
 글로벌 식품기업인 N사는 계절성과 프로모션 효과가 강한 피자와 아이스크림을 판매합니다. 이 회사는 최근 제품이 다양해지면서 배송 센터 대기 시간을 줄이기 위한 운송 공간 활용, 최적의 배송량, 목적지 적정성, 정시 전달 등이 이슈가 되었습니다.
이를 해결하기 위해 계절과 프로모션 이벤트를 고려한 SAS Visual Forecasting의 예측 방법론을 적용하여 SCM상 판매 및 배송 총량을 예측하고, 어떤 프로모션이 수익성을 높여줄 수 있는지 시뮬레이션을 했습니다. 그로 인해 예측 정확도를 4% 향상시키고, 더 수익성 있는 프로모션 계획이 가능해졌습니다. 재고 비용을 균일하게 유지하면서 수익을 높이게 된 것입니다.
SAS Visual Forecasting으로 예측하는 방법
SAS Visual Forecasting은 구체적으로 미래를 어떻게 변화시킬 수 있을까요? 여기, 품목별, 지역별, 주별 판매량을 예측하기 위해 시계열 예측을 하려는 기업이 있습니다. 단가와 16개의 캘린더 이벤트를 영향 요인으로 구성하여 주별 판매량을 예측하고자 합니다. 영향 요인에서 ‘단가’는 통제 가능한 변수입니다. 따라서 단가 변화에 따라 매출 금액이 어떻게 변화하는지 시뮬레이션 할 수 있습니다. 반면 명절, 어린이날, 크리스마스와 같은 ‘캘린더 이벤트’는 통제할 수 없는 변수로, 미래를 변화시키는 요인으로 사용할 수 없습니다.
현황 분석
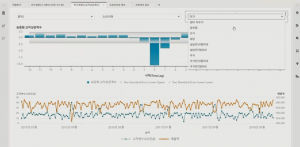
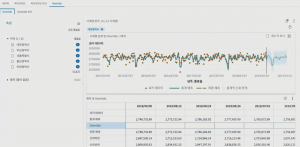
![]() 시계열 예측에 앞서 먼저, 데이터 현황을 살펴봅니다. SAS Visual Forecasting은 SAS Visual Analytics 위에 탑재되기 때문에 데이터 탐색 및 시각화 도구를 사용하여 다양한 그래프와 표를 활용하여 리포트를 구성할 수 있습니다
시계열 예측에 앞서 먼저, 데이터 현황을 살펴봅니다. SAS Visual Forecasting은 SAS Visual Analytics 위에 탑재되기 때문에 데이터 탐색 및 시각화 도구를 사용하여 다양한 그래프와 표를 활용하여 리포트를 구성할 수 있습니다
변수 영향도 파악
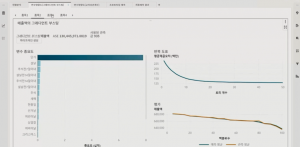
변수 영향도를 알아보기 머신러닝 알고리즘인 그래디언트 부스팅을 수행합니다. 머신러닝 알고리즘은 동일 기간의 영향도를 측정하는 방법으로, 과거 시점의 변수 영향도를 측정하기 위해서는 과거 시점의 데이터를 생성해야 하는 번거로움이 있습니다. 반면, 교차상관 분석은 과거 특정 시점의 변수 영향도가 현재 타깃에 어떤 관계를 가지는지 파악할 수 있습니다. <교차상관 분석 그래프>의 결과를 보면 금주와 전주의 단가가 금주의 매출에 음의 관계로 영향을 주는 것을 확인할 수 있습니다. 즉, 금주의 단가를 올리면 금주와 차주의 매출이 떨어지고, 단가를 내리면 매출이 증가한다라는 결과를 도출할 수 있습니다. 이를 통하여 단가를 어떻게 조절하는 것이 수익을 극대활 할 수 있는지 시뮬레이션 할 수 있습니다.
프로토타입 예측
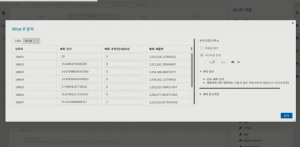
파악한 변수 영향도를 토대로 프로토타입을 예측합니다. 프로토타입 예측은 관심 시계열을 특정하여 손쉽게 예측하는 기능으로, 어떤 변수가 매출 예측에 사용됐는지 확인할 수 있습니다. 해당 결과를 바탕으로 What-If 시뮬레이션을 수행합니다. 즉, 단가를 조절하였을 경우 매출이 얼마만큼 변화되는지를 예측할 수 있습니다.
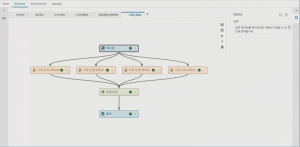
Visual Pipeline을 통한 시계열 예측
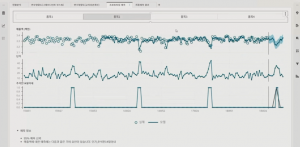
Visual Pipeline을 통해 대규모 예측을 수행할 수도 있습니다. Visual Pipeline 에서 예측한 결과는 시각화를 통해 리포트를 구성하고, 그에 따른 품목별 지역별 매출 추이와 향후 매출 변화를 확인할 수 있습니다. 또한, 사용자가 예측치 조장(Override) 기능을 통하여 예측된 결과를 임의로 조정할 수 있는 기능 또한 제공합니다.
미래를 변화시키는 SAS Visual Forecasting
이처럼 SAS Visual Forecasting은 분산 인메모리 처리를 통한 많은 시계열 모델을 자동으로 생성합니다. 또한 GUI 환경에서 드래그 앤 드롭, 포인트 앤 클릭 방식으로 손쉽게 모델링을 할 수 있습니다. 예측 변수에 영향을 미치는 비즈니스 동인인 휴일 또는 이벤트를 자동으로 선별해주므로 내외부 요인을 고려한 What-If 시뮬레이션이 가능하기 때문에 전략 변경에 따른 변화를 탐지할 수 있습니다. 이 외에도 계층 내에서 Top-Down(하향식), Bottom-Up(상향식), Middle-Out(중간형) 조정 기능으로 예측 결과에 대한 일관성을 유지할 수 있습니다.