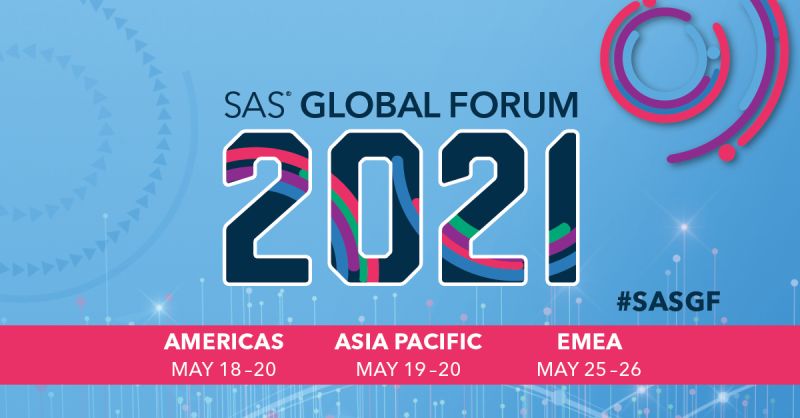
SAS Global Forum 2021 will be jam-packed with inspiring content. Register today to ensure you don't miss a second of this year's event.

SAS Global Forum 2021 will be jam-packed with inspiring content. Register today to ensure you don't miss a second of this year's event.

Predictive models and medical image analysis have the potential to transform health care delivery. To accelerate innovative approaches in health analytics, teams around the world are participating in a global hackathon. In scientific communities, it's well-known that the fastest way to drive progress and discover new ideas is collaboration with

The people, the energy, the quality of the content, the demos, the networking opportunities…whew, all of these things combine to make SAS Global Forum great every year. And that is no exception this year. Preparations are in full swing for an unforgettable conference. I hope you’ve seen the notifications that