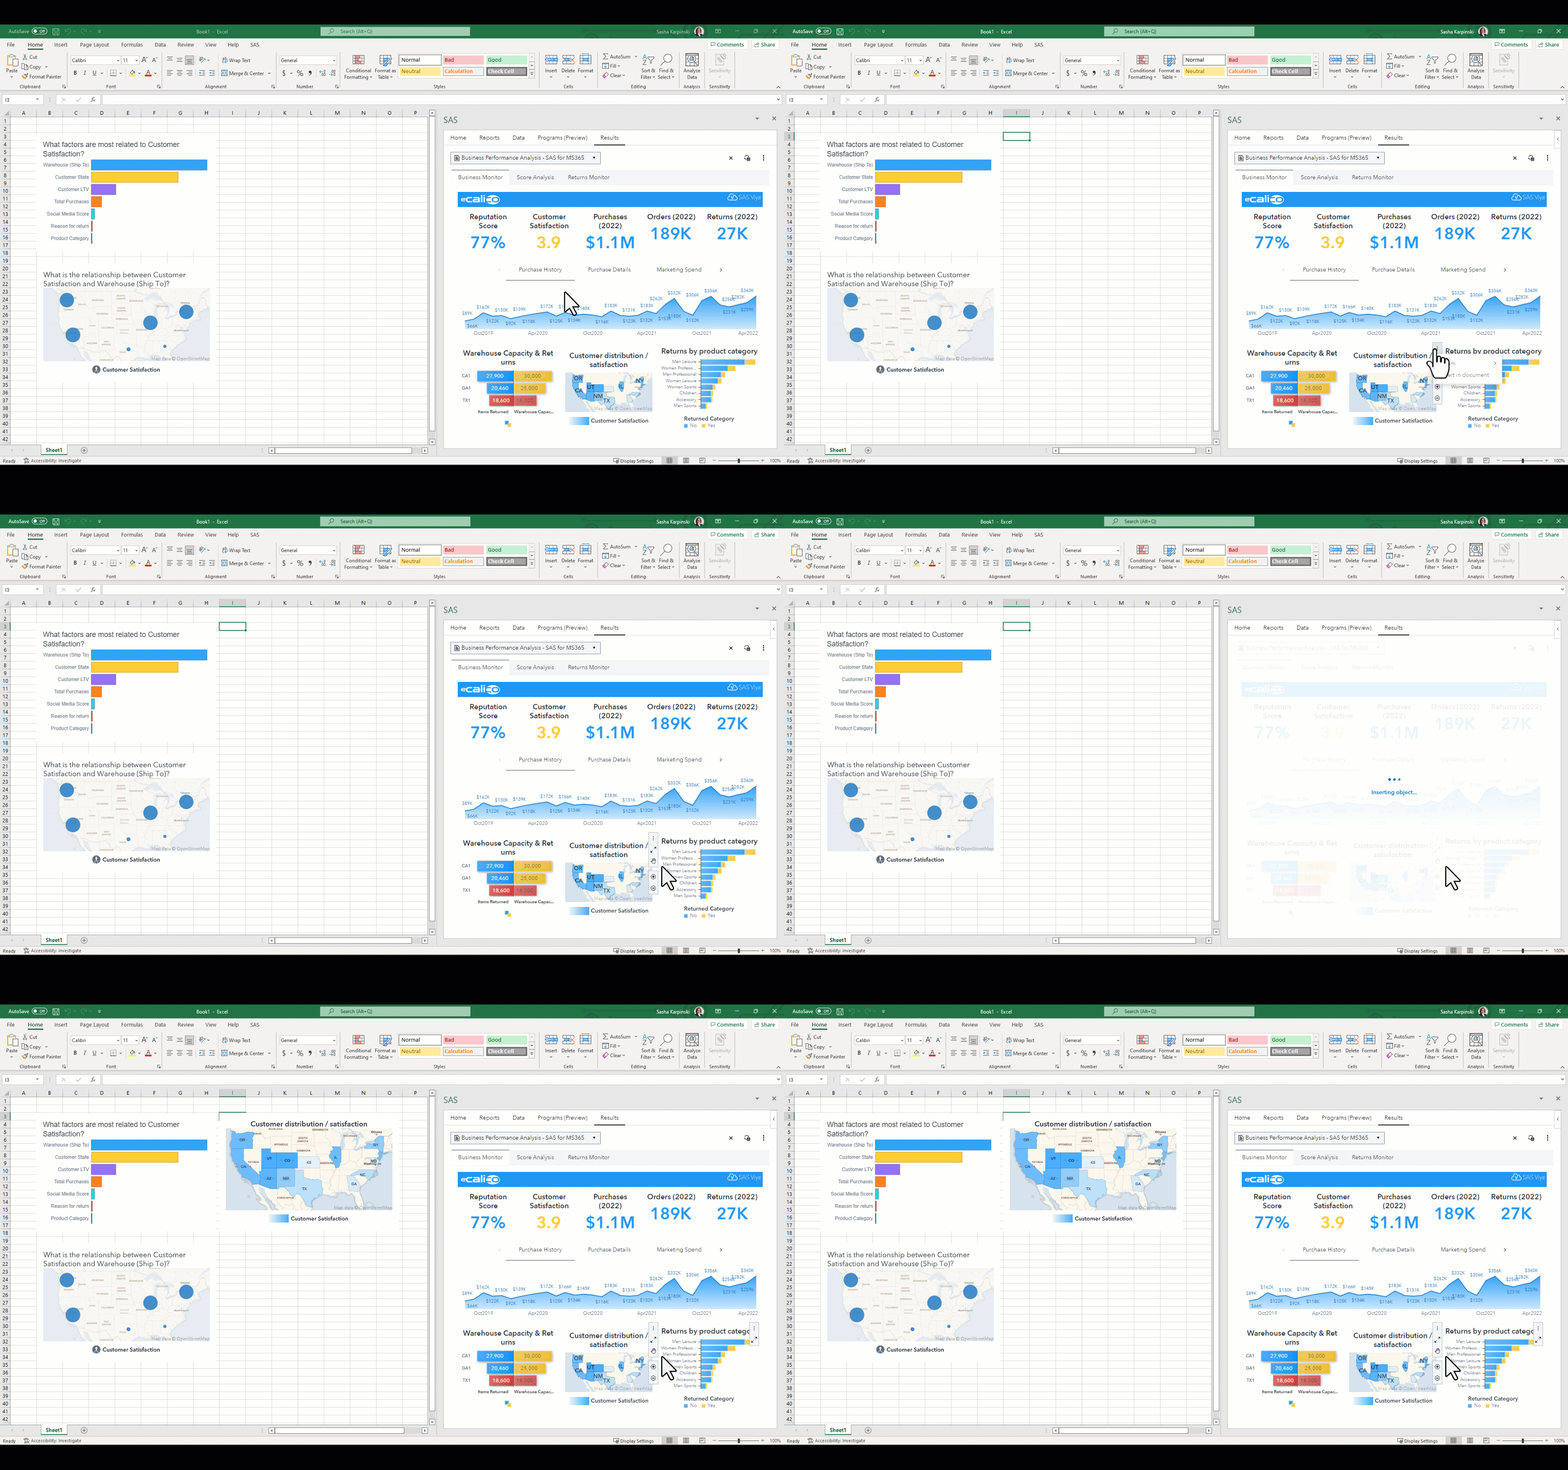
Using SAS for Microsoft 365, you can enhance your Excel spreadsheets with additional insights from SAS Viya via one seamless integrated experience.

The addition of the PYTHON procedure and Python editor in SAS Viya enables users to execute Python code in SAS Studio. This new capability in SAS Viya adds another tool to SAS's existing collection. With this addition I thought, how can I utilize this new found power? In this example,
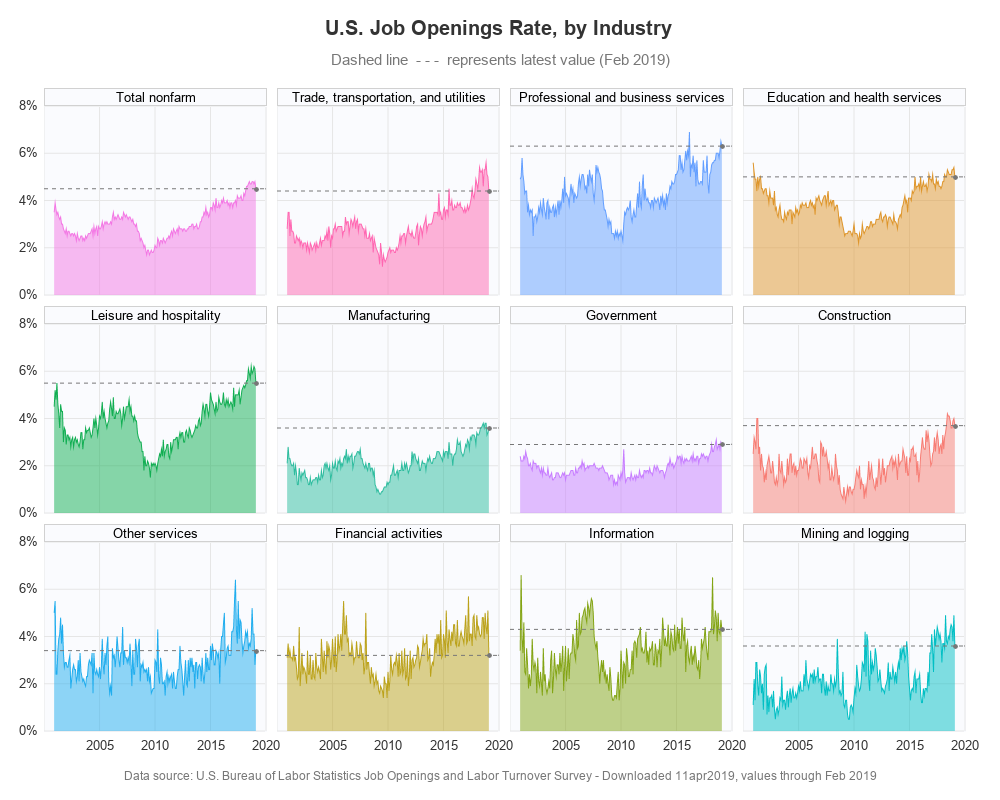
In the past, I created some graphs about our record low unemployment rate (US unemployment, and state-level unemployment), but does low unemployment also mean there are jobs available? Let's have a look at the data!... Existing Graphs I knew I couldn't be the only one interested in this kind of