SAS Users
Providing technical tips and support information, written for and by SAS users.
Are you a SAS certified professional?
The SAS Global Certification Program started in 1999 and has issued over 150,000 credentials to SAS users. Today, the program offers 23 different credentials across seven categories.

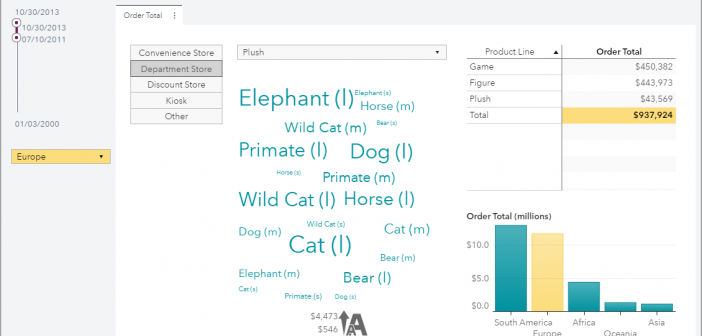
New control prompt placement option in SAS Visual Analytics
Introduced in the SAS Visual Analytics 8.4 release is the ability to control the layout position of these prompts. Using my example report, let’s change the placement of these prompts.

Testing the Assumption of Normality for Parametric Tests
The t-test is a very useful test that compares one variable (perhaps blood pressure) between two groups. T-tests are called t-tests because the test results are all based on t-values. T-values are an example of what statisticians call test statistics. A test statistic is a standardized value that is calculated


