The SAS Dummy
A SAS® blog for the rest of usIt was just a couple of years ago that folks were skeptical about the term "data scientist". It seemed like a simple re-branding of an established job role that carried titles such as "business analyst", "data manager", or "reporting specialist". But today, it seems that the definition of the "Data

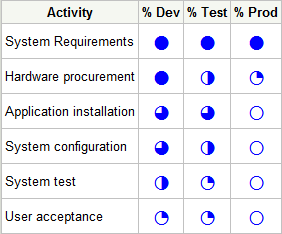
I'm currently working on a large project for a SAS customer. The project comprises many activities and phases, so there is a need to track progress on many different levels. During a recent meeting the project manager announced, "I'm putting together a status deck, and I'll include some Harvey Balls

When you run a program or task in SAS Enterprise Guide, the application wraps your job in an "ODS sandwich", the colloquial term we use for the ODS statements necessary to create output that can be viewed in your project. That's convenient for exploring and refining your program, but at
