Graphically Speaking
Data Visualization with a focus on SAS ODS Graphics
I hope everyone has noticed some new shortcuts in Graphically Speaking. As you scroll down and look to the right, there are shortcuts for Sanjay's getting started and clinical graphs posts and one for my advanced blogs. When Sanjay asked me to make an icon for my advanced blogs, at

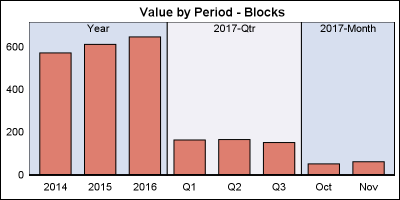
Off and on, users have expressed the need to include multiple blank categories on a discrete axis. Often, this is desirable to separate groups of bars (or categories) in a graph due to some difference their definition. Such a case was discussed in this blog article on using non breaking

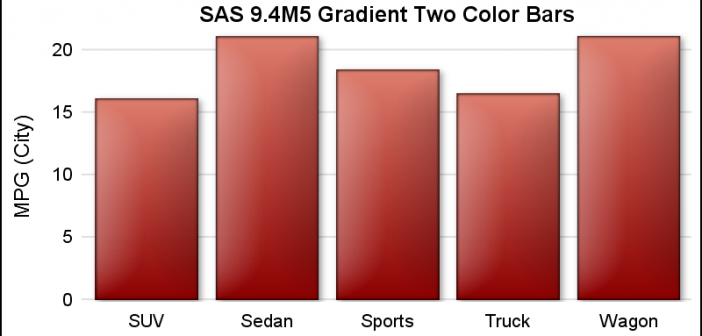
ODS Graphics procedures primarily strive towards the following goal: "Make simple graphs easy and complex graphs possible". SGPLOT procedure allows you create simple graphs with a single plot statement, and create complex graphs by layering together or combining multiple plot statements. Generally, the appearance follows the guidelines set by industry

