Author

Falko Schulz
RSS
Distinguished Software Developer, Business Intelligence R&D

Falko Schulz is Distinguished Software Developer in the SAS Business Intelligence Research and Development division. He works actively on products such as SAS® Visual Analytics further enhancing user experience and analytical capabilities. Falko has a strong background in delivering business analytical applications in a wide range of industries. Prior to joining the R&D division Falko worked in customer facing roles responsible for critical technical implementations and BI architectural designs. During his 19 years at SAS, Falko worked out of various countries including Germany, Australia and US.

Advanced Analytics | Analytics | Artificial Intelligence | Data Visualization | Machine Learning
Falko Schulz 0
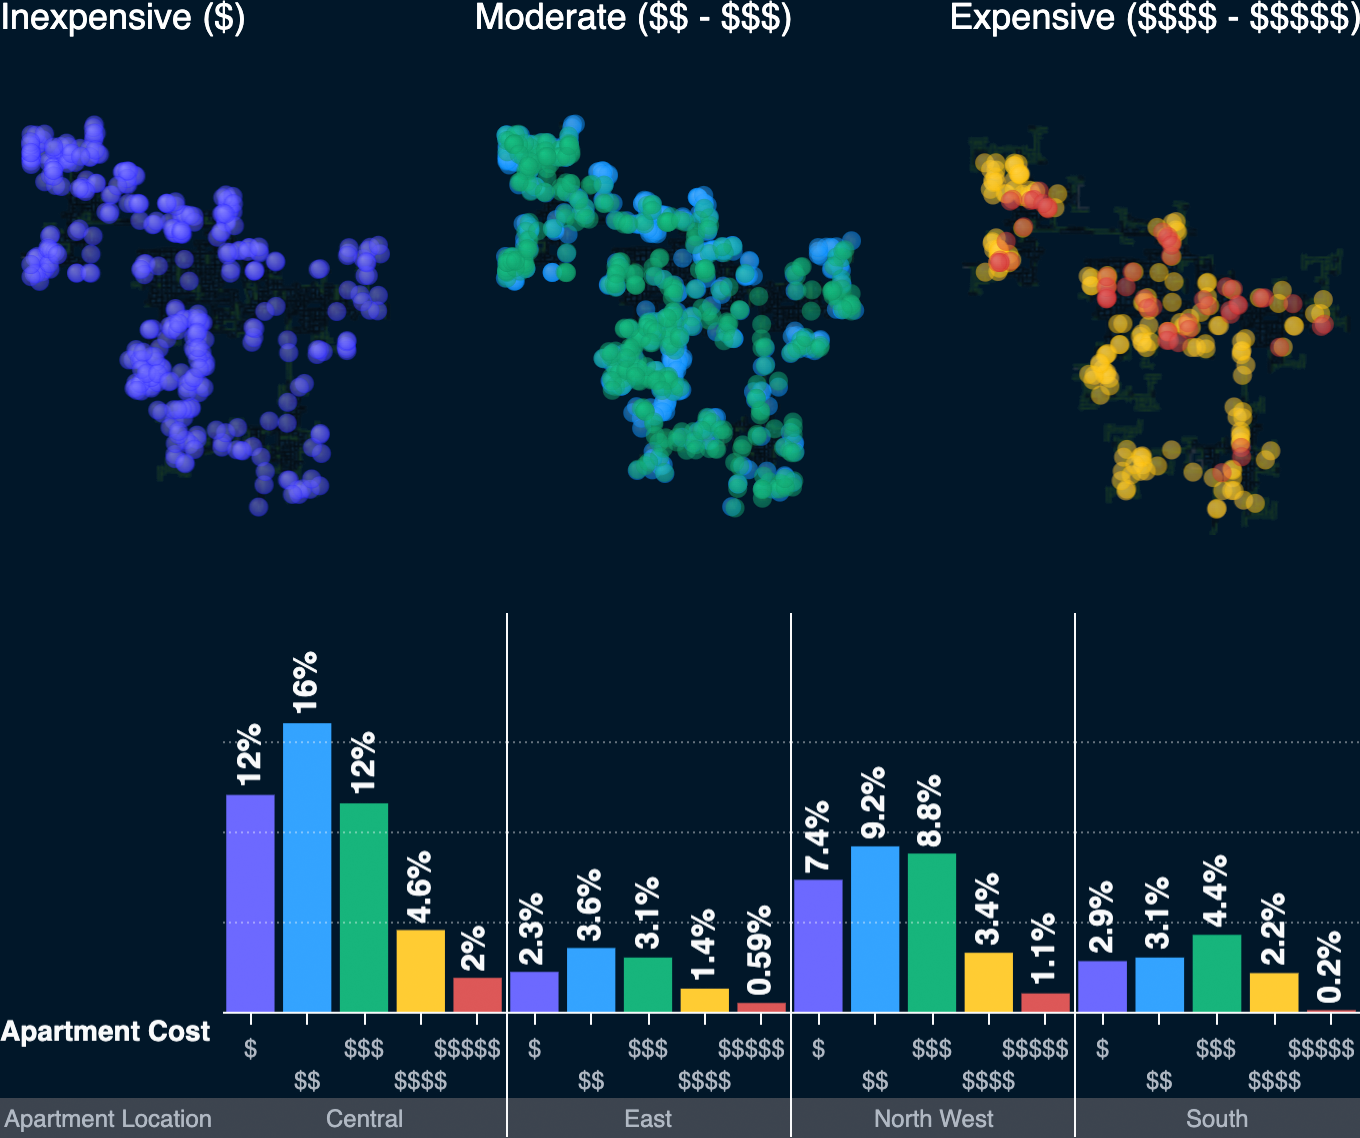
Analyzing demographics and patterns-of-life using SAS Visual Analytics

The IEEE Visual Analytics Science and Technology (VAST) Challenge provides a great opportunity to validate our software against real-world scenarios using complex data sets. Not only do we learn from these projects, but we also send feedback to our development teams to further improve product capabilities for customers.

Advanced Analytics | Data Visualization | Machine Learning
Falko Schulz 0
Analyzing movement and tracking data using SAS Visual Analytics

Technological advancements in connectivity and global positioning systems (GPS) have led to increased data tracking and related business use cases to analyze such movements. Whether analyzing a vehicle, an animal or a population's movements - each use case requires analyzing underlying spatial information. Global challenges such as virus outbreaks, deforestation

Advanced Analytics | Analytics | Data Visualization
Falko Schulz 0
Analyze ticket sales using location analytics and customer segmentation in SAS® Visual Analytics

Analyzing ticket sales and customer data for large sports and entertainment events is a complex endeavor. But SAS Visual Analytics makes it easy, with location analytics, customer segmentation, predictive artificial intelligence (AI) capabilities – and more. This blog post covers a brief overview of these features by using a fictitious event company

Data Visualization
Falko Schulz 0
Path analysis with SAS Visual Analytics

Introduction Understanding the behavior of your customers is key to improving and maintaining revenue streams. It is a an important part when crafting successful marketing campaigns. With SAS Visual Analytics 7.1 you can analyze, explore and visualize user behavior, click paths and other event-based scenarios. Monitoring the customer journey by visualizing