All Posts


If you're an administrator of systems that run SAS, you have probably already read up on How to Maintain Happy SAS 9 Users. If not, go read that first. Now, are you looking to squeeze the best performance out of SAS on Microsoft Windows 2008 Server? Be sure to read


My previous post on creating a random permutation started me thinking about word games. My wife loves to solve the daily Jumble® puzzle that runs in our local paper. The puzzle displays a string of letters like MLYBOS, and you attempt to unscramble the letters to make an ordinary word.
I recently read a paper that described a SAS macro to carry out a permutation test. The permutations were generated by PROC IML. (In fact, an internet search for the terms "SAS/IML" and "permutation test" gives dozens of papers in recent years.) The PROC IML code was not as efficient

A previous post described a simple algorithm for generating Fibonacci numbers. It was noted that the ratio between adjacent terms in the Fibonacci sequence approaches the "Golden Ratio," 1.61803399.... This post explains why. In a discussion with my fellow blogger, David Smith, I made the comment "any two numbers (at
Space is big. You just won't believe how vastly, hugely, mind-bogglingly big it is. I mean, you may think it's a long way down the road to the drug store, but that's just peanuts to space. - Douglas Adams, Hitchhiker's Guide to the Galaxy SAS is big. It's not quite

Often, the first step of a SAS/IML program is to use the USE, READ, and CLOSE statements to read data from a SAS data set into a vector or matrix. There are several ways to read data: Read variables into vectors of the same name. Read one or more variables

Since its 4.2 release, SAS Enterprise Guide has been able to import Microsoft Excel 2007 and 2010 spreadsheet files (usually encountered as .XLSX files). But while SAS Enterprise Guide can export XLS files (which are compatible with all versions of Microsoft Excel), it does not have the ability to export

In a previous blog post about hurricanes, I created a histogram of the occurrence of tropical cyclones in the Atlantic basin during the years 1988–2003. That histogram shows that the peak of hurricane activity occurs in the second week of September, but also that a majority of tropical storms occur

This morning I read an interesting post about the design of the new Twitter Web page. The post included some R code to generate the ratio between adjacent terms in the Fibonacci seqence. The ratio converges to the "Golden Ratio": 1.61803399.... I'm sure that many R gurus will post simpler
I saw a suggestion arrive from a SAS customer who would like to see the IN operator extended to allow ranges of date values. For example, you can currently write a program that checks for values IN a collection or range of numbers: data check; if x in (1:10) then
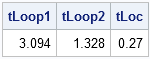
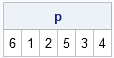
The SAS/IML language is a vector language, so statements that operate on a few long vectors run much faster than equivalent statements that involve many scalar quantities. For example, in a previous post, I asserted that the LOC function is much faster than writing a loop, for finding observations that

AnnMaria wrote her latest blog post, "SAS Enterprise Guide makes you smarter", partly in response to my recent post about whether it's making you stupider. From the contents of her program example, I'm guessing that she's preparing for WUSS in November. I don't get to attend this year, but my
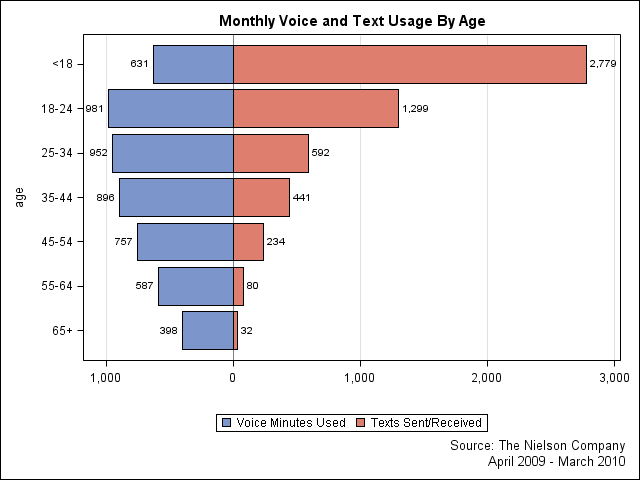
The Junk Chart blog discusses a potential problem that can arise in grouped bar charts when the two groups have vastly different ranges. One possible solution (which is discussed at the Junk Chart sister blog, Numbers Rule Your World) is to present the data back-back in what is sometimes called


We have all heard the old axiom that all politics are local. Recently, I have been in discussions about international responses to major disasters, Specifically, the floods in Pakistan, Haitian earthquake and Indonesia tsunami of 2004. In each of those cases, there were massive international responses to the crisis. Numerous
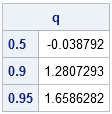
The SAS/IML run-time library contains hundreds of functions and subroutines that you can call to perform statistical analysis. There are also many functions in Base SAS software that you can call from SAS/IML programs. However, one day you might need to compute some quantity for which there is no prewritten