All Posts


I helped to write a quiz for the Computer Science Education Week promotions that were featured on our company intranet. Do you fancy yourself as a Comp-Sci aficionado? Let's see how you do with these. 1. Which achievement is Charles Babbage most famous for? A. Establishing software retail shops in


Imagine you are attending the BCS National Championship game next month. You have invested top dollar in your seats and you have been anticipating the game for weeks. You settle in to your seat with your hot dog, soft pretzel, and your favorite beverage a few minutes before kick-off because


Both covariance matrices and correlation matrices are used frequently in multivariate statistics. You can easily compute covariance and correlation matrices from data by using SAS software. However, sometimes you are given a covariance matrix, but your numerical technique requires a correlation matrix. Other times you are given a correlation matrix,

I connect to more SAS server environments than your average SAS user. In a given week, I probably run SAS Enterprise Guide connecting to at least five different Windows-based servers, a few Unix-based servers, and maybe even a z/OS machine as well. With that many SAS environments, I'm bound to
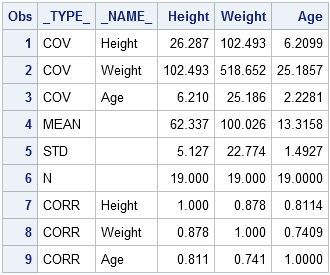
Sample covariance matrices and correlation matrices are used frequently in multivariate statistics. This post shows how to compute these matrices in SAS and use them in a SAS/IML program. There are two ways to compute these matrices: Compute the covariance and correlation with PROC CORR and read the results into

I enjoy reading about the Le Monde puzzles (and other topics!) at Christian Robert's blog. Recently he asked how to convert a number with s digits into a numerical vector where each element of the vector contains the corresponding digit (by place value). For example, if the number is 4321,
Computer science is more than the pursuit of "let's see what we can make this computer do." If that's your only goal, then you might make a fine computer geek, but a lousy computer scientist. In her blog post for Computer Science Education Week, Caroline McCullen reminds us that computer
The SAS/IML language enables you to perform matrix-vector computations. However, it also provides a convenient "shorthand notation" that enables you to perform elementwise operation on rows or columns in a natural way. You might know that the SAS/IML language supports subscript reduction operators to compute basic rowwise or columnwise quantities.
My last post was a criticism of a statistical graph that appeared in Bloomberg Businessweek. Criticism is easy. Analysis is harder. In this post I re-analyze the data to present two graphics that I think should have replaced the one graphic in Businessweek. You can download the SAS program that


Have you used multivariate procedures in SAS and wanted to save out scores? Some procedures, such as FACTOR, CANDISC, CANCORR, PRINCOMP, and others have an OUT= option to save scores to the input data set. However, to score a new data set, or to perform scoring with multivariate procedures that

It seems like each week brings news announcing yet another software vendor acquisition by one of the giant software conglomerates. This approach of purchasing a specific capability to fit into the ever growing portfolio of technology does not show signs of stopping in the near future. Matter of fact, several

Author note: I'm "replaying" this post in honor of Computer Science Education Week. It originally appeared here over 3 years ago. Today was "career day" in my daughter's 3rd grade classroom. A few privileged parents were invited to attend and answer questions about their professions, press-conference style. Among those on
Recently I read a blog that advertised a data visualization competition. Under the heading "What Are We Looking For?" is a link to a 2007 Bloomberg Businessweek graph that visualizes how participation in online social media activities vary across age groups. The graph is reproduced below at a smaller scale:
Next week we'll be celebrating Computer Science Education Week. SAS is a partner in this event, which makes complete sense because we have a vested interest in creating more computer scientists. After all, SAS does employ a lot of them. When I was enrolled in a computer science program (sometime

Japan has a superfast train called the Shinkansen. The first I heard of it was when my sister visited Japan on a scholarship. Engine-awestruck, we wanted a ride, but weren’t able to get to Japan. Nor, did we know the language. (With over 5000 kanjis, it took my sister 3