The topic of cluster groups comes up often. By cluster group I am referring to the feature in bar charts where the group values are displayed side by side.
With SAS 9.3, SG Procedures support stack or cluster grouping for Bar Charts and overlay or cluster grouping for all other plot statements. Here are a couple of examples:
Cluster group Bar Chart with SAS 9.3:
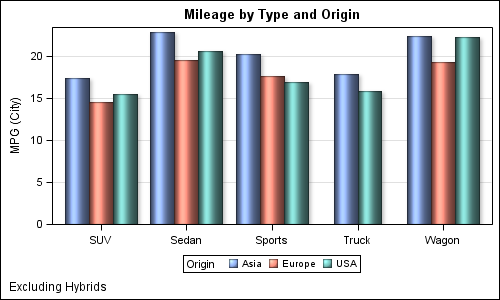
SAS 9.3 code:
title 'Mileage by Type and Origin'; footnote j=l 'Excluding Hybrids'; proc sgplot data=sashelp.cars; where type ne 'Hybrid'; vbar type / response=mpg_city stat=mean group=origin groupdisplay=cluster dataskin=sheen nostatlabel; xaxis display=(nolabel); yaxis grid; run; |
Cluster grouped Lipid Graph with SAS 9.3:
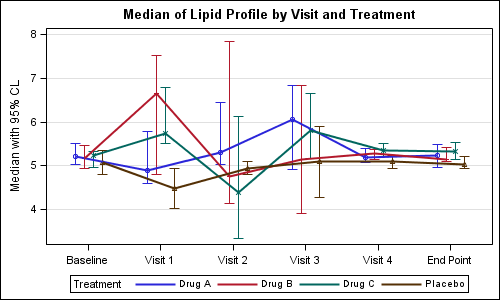
SAS 9.3 code snippet:
title 'Median of Lipid Profile by Visit and Treatment'; proc sgplot data=lipid_grp; scatter x=day y=median / yerrorlower=lcl yerrorupper=ucl group=trt groupdisplay=cluster clusterwidth=0.5 errorbarattrs=(thickness=1); series x=day y=median / lineattrs=(pattern=solid) group=trt groupdisplay=cluster clusterwidth=0.5 lineattrs=(thickness=2) name='s'; yaxis label='Median with 95% CL' grid; xaxis display=(nolabel); keylegend 's' / title='Treatment'; run; |
But these options were not available earlier so what to do if you are using SAS 9.2? One way to "simulate" the cluster group arrangement is to use the SGPANEL procedure. This procedure arranges the cells by class variables, and we can leverage this ability to create a cluster grouped "like" graph.
Cluster grouped Bar Chart using SAS 9.2 SGPANEL procedure:
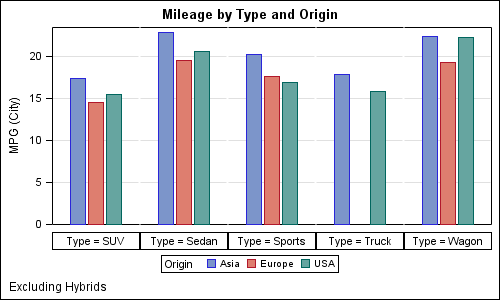
SAS 9.2 code:
title 'Mileage by Type and Origin'; footnote j=l 'Excluding Hybrids'; proc sgpanel data=sashelp.cars; where type ne 'Hybrid'; panelby type / layout=columnlattice onepanel noborder colheaderpos=bottom; vbar origin / response=mpg_city stat=mean nostatlabel group=origin; colaxis display=none offsetmin=0.3 offsetmax=0.3; rowaxis grid; run; |
Cluster grouped Lipid Graph using SAS 9.2 SGPANEL procedure:
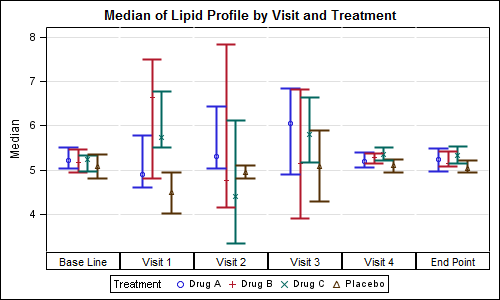
When I first posted this graph in this the article, I used "DAY" as the class variable on the PANELBY statement. While that is usually fine, DAY is a character variable and SGPANEL reorders the values alphabetically. So, the order of the values in the graph, "Base Line" to "End Point" got rearranged. Not good.
So, I now used a new DAYN (numeric) variable, with values 1 - 6, formatted to the above visit names. Using DAYN retains the order I need for this graph.
SAS 9.2 code snippet:
title 'Median of Lipid Profile by Visit and Treatment'; proc sgpanel data=lipid_grp; panelby dayn / layout=columnlattice onepanel noborder colheaderpos=bottom novarname; scatter x=trt y=median / yerrorlower=lcl yerrorupper=ucl group=trt errorbarattrs=(thickness=2) markerattrs=(size=9) name='s'; keylegend 's' / title='Treatment'; colaxis display=none offsetmin=0.3 offsetmax=0.3; rowaxis grid; run; |
While the Bar Chart simulation is reasonably close, for the Lipid Graph we cannot join the lines across cells, like we did for the SAS 9.3 version. OFFSETMIN and OFFSETMAX options are set in the COLAXIS statement to compress the observations closer in each cell.
Full SAS 9.3 code: Cluster_Groups_V93
Full SAS 9.2 code: Cluster_Groups_V92


