All Posts


Timothy Rey from The Dow Chemical Company describes how to get the most value from your data using mining techniques specific to data collected over time.

Managers, boards of directors, executives - everyone needs up-to-date information for decision making. And today that often means they need it in real-time. James Beaver and Tobin Scroggins from Farm Bureau Bank give their users the option of emailed reports for this real-time or near real-time information, or the users
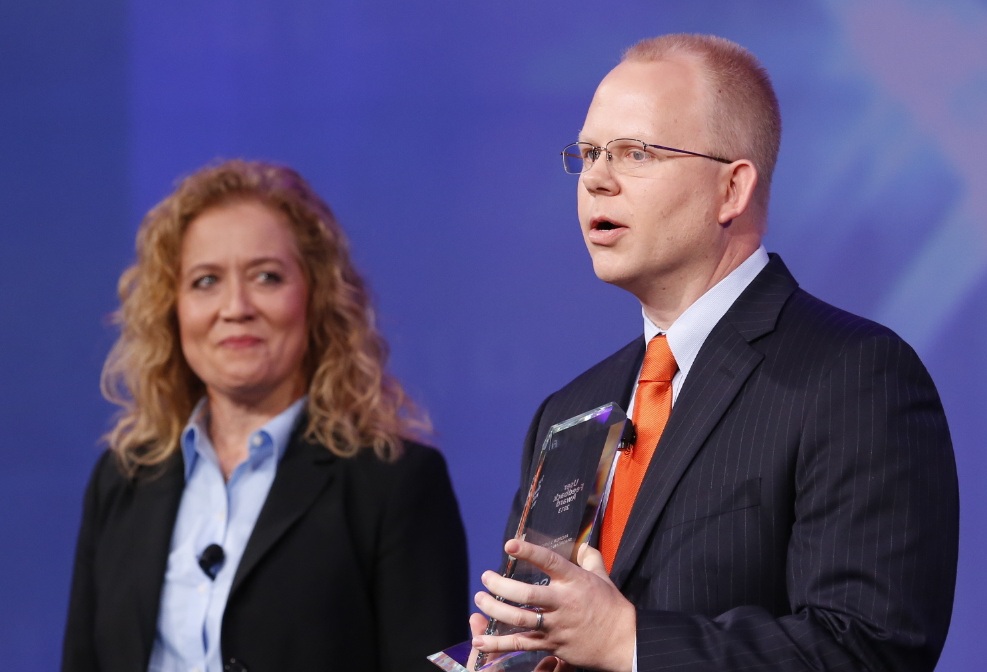

It was a packed house at the Moscone West Center in San Francisco last night as more than 4,000 SAS users and employees from around the world gathered together to officially kick off SAS® Global Forum. Following the live software demos from customers and SAS development teams, Technical Support Vice
Big data, social, Bayesian techniques, and new methods being developed every day, according to Jennifer Waller of Georgia Regents University. Watch this Inside SAS Global Forum interview for details. Be sure to check out the ending.
Anna Brown talks to Tyler Smith of National University about the International Year of Statistics and why it's important for businesses to use statistics when making decisions. He also talks about the role of statistics in the health industry. Watch it now on the SAS Global Forum livestream: sasglobalforum on
SAS presenters highlight software features built on SAS 9.4 platform and share the 2013 product release roadmap for these technology themes: high-performance analytics business visualization data management decision management cloud sasglobalforum on livestream.com. Broadcast Live Free

What a conference so far... SAS Global Forum is now in full swing, and the two big sessions (Opening Session last night, and the Tech Session this morning) have been packed with impressive material. The attendees I've spoken with have been suitably impressed and enthused. You can view the sessions
Jim Goodnight kicks off SAS Global Forum with a look back the first SAS visit to San Francisco in 1982 - when everything was big including hair, cell phones and computers! Now, small computers deliver big data and we can access that data on even smaller devices such cell phones


The TV show Cheers was set in a bar "where everybody knows your name." Global knowledge of a name is appealing for a neighborhood pub, but not for a programming language. Most programming languages enable you to define functions that have local variables: variables whose names are known only inside
Editor's note: this article was originally published on The SAS Dummy blog. In the SAS User Groups LinkedIn group, some generous "old timers" offer tips to the potentially shy newcomers for connecting with other SAS professionals at SAS Global Forum. Perhaps these folks remember their own introverted natures, and they
There's nothing like SAS Global Forum and no place like San Francisco! Everyone around me is packing up cameras and notebooks, including SAS' roving reporter Anna Brown. For those who can't make it this year, Anna's Inside SAS Global Forum video series is the next best thing to being there.


"Food choices not only directly influence our health, but profoundly influence the health of the planet." There are many reasons why buying local foods is the best way to go! Here are just a few: 1. Local Food Tastes Better When you are shopping at a farmers market or picking

SAS Global Forum is like a BIG buffet of SAS knowledge, all served up in just a few days. There are so many good presentations and activities, but you cannot fit them all on your plate. You have to choose. To make the choices easier, the SAS Global Forum committee
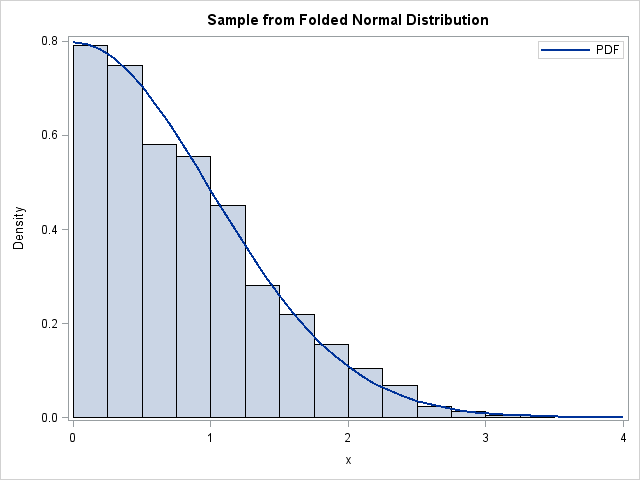
I've previously described how to overlay two or more density curves on a single plot. I've also written about how to use PROC SGPLOT to overlay custom curves on a graph. This article describes how to overlay a density curve on a histogram. For common distributions, you can overlay a


Sometimes, it is good to start with a confession. I filed my taxes at the last minute. It was past time to get some money back from the IRS before they could waste $60,000 on another Star Trek spoof video. Normally I'm one of those people that files in February,