All Posts

A couple of weeks back we had a question on how to make a bar chart with stacked and clustered groups. User also wanted to display the value for each stacked segment below the bars. The article Bar Charts with Stacked and Cluster Groups shows how to create such a
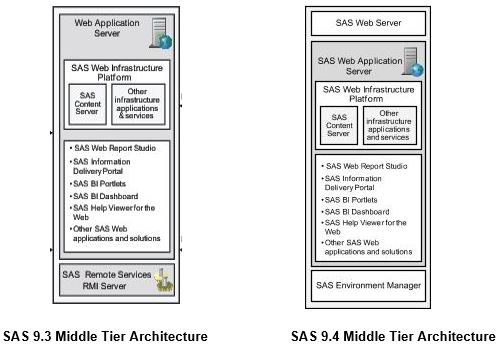

My family are all Lord of the Rings Trilogy fans. As a novice in the world of SAS administration, I find discussing the SAS middle tier architecture a little like traveling through Middle Earth. For me, it’s new and fascinating terrain. And like other travelers, I would find it useful
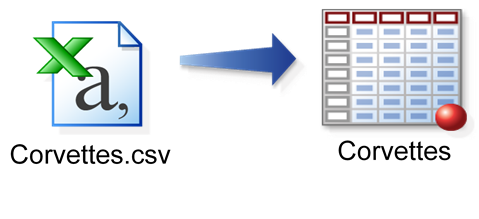

Sometimes, your first impulse may not be correct, like trading in your practical sedan for a hot 2-seater. Other times, your first impulse is perfect, as in the examples below. Suppose the automobile data you wish to analyze resides in a CSV file. Naturally, your first impulse is to import
Recently, SAS released SAS Solutions OnDemand for academics. An academic user who is signed up for this can use the SAS Web Editor application to do all their data analysis over the web using a hosted server at SAS. This frees up the user from having to install the software on their own computers,


A couple of years ago I shared a method for copying any file within a SAS program. It was a simple approach, copying the file byte-by-byte from one fileref (SAS file reference) to another. My colleague Bruno Müller, a SAS trainer in Switzerland, has since provided a much more robust
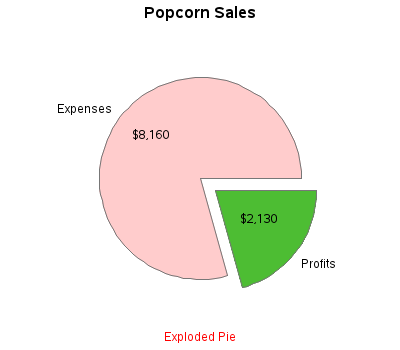

There's an old expression "easy as pie." Have you ever tried to bake a pie??? ... It's not so easy, LOL! And neither is using pie charts correctly! :) Below are several examples of different kinds of pie charts you can create with SAS/GRAPH. And at the bottom of this
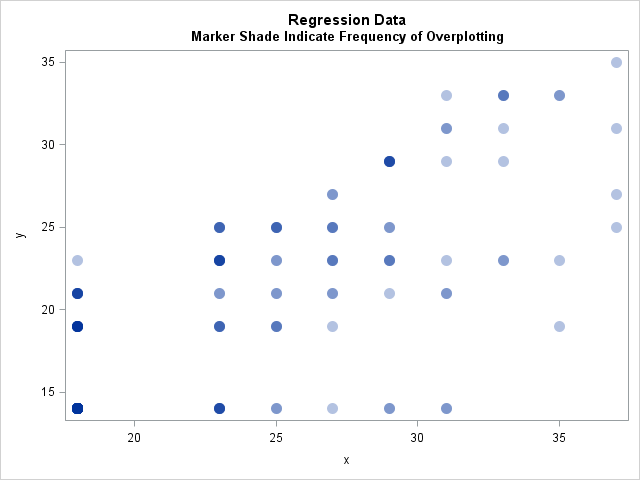

This week I read an interesting blog post that led to a discussion about specifying the frequencies of observations in a regression model. In SAS software, many of the analysis procedures contain a FREQ statement for specifying frequencies and a WEIGHT statement for specifying weights in a weighted regression. Theis


Like many of you teachers out there, I spent a lot of time recently preparing for the new school year. At home, it began with the therapeutic organization of children's rooms. As I sat amid in outgrown clothes, last year’s school work, and books to donate, I braced myself and

One of our readers asked if we could explain some of the thinking behind SAS’ recent decision to modify its support for US regional users groups. Over the past five to ten years, users have been telling SAS they need more targeted, more local and more immediate types of support, especially technical
SAS Data Management is a popular topic here on the SAS interwebs. You can find all types of information ranging from thought leadership to white papers to product details. At SAS Global Forum I sat down with Nancy Rausch, one of the principal R&D managers behind the SAS Data Management
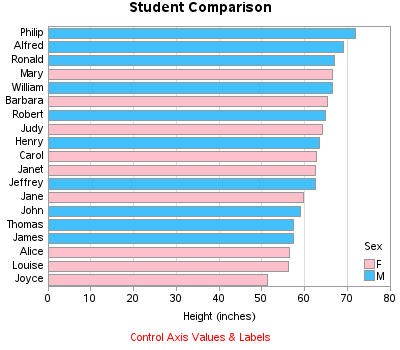
Do you know how to create a bar chart using SAS, and when to use what kind of bar chart?!? If the answer doesn't come to you "easy as pie" then this blog is for you! Below are several examples of different kinds of bar charts you can create with SAS/GRAPH.


Please register and join SAS Product Manager Amy Peters on September 26 at 1:00 pm ET for a SAS Talks webinar: SAS 9.4: What's New for SAS Administrators. This SAS Talks webinar is laser-focused on enhancements and changes that will interest SAS administrators. Specifically, Amy will highlight how the new


Another summer has almost come and gone and fall is on its way bringing cooler temperatures, lower humidity, and colorful leaves. However, just because fall is knocking on our door doesn’t mean we have to stop enjoying our favorite summer produce. If you’re a home gardener or a frequent flyer
Creating bar charts with group classification is very easy using the SG procedures. When using a group variable, the group values for each category are stacked by default. Using the sashelp.prdsale data set and default STAT of SUM, here is the graph and the code. SGPLOT code: proc sgplot data=sashelp.prdsale;
It's been almost 5 years since I posted one of the first custom tasks for SAS Enterprise Guide. It was a task that made it easier to convert SPSS data files into SAS data sets. Like many projects that begin as custom tasks, this one later became a feature in